Egyptian vs Immigrants from China Median Earnings
COMPARE
Egyptian
Immigrants from China
Median Earnings
Median Earnings Comparison
Egyptians
Immigrants from China
$51,701
MEDIAN EARNINGS
99.9/ 100
METRIC RATING
55th/ 347
METRIC RANK
$56,638
MEDIAN EARNINGS
100.0/ 100
METRIC RATING
13th/ 347
METRIC RANK
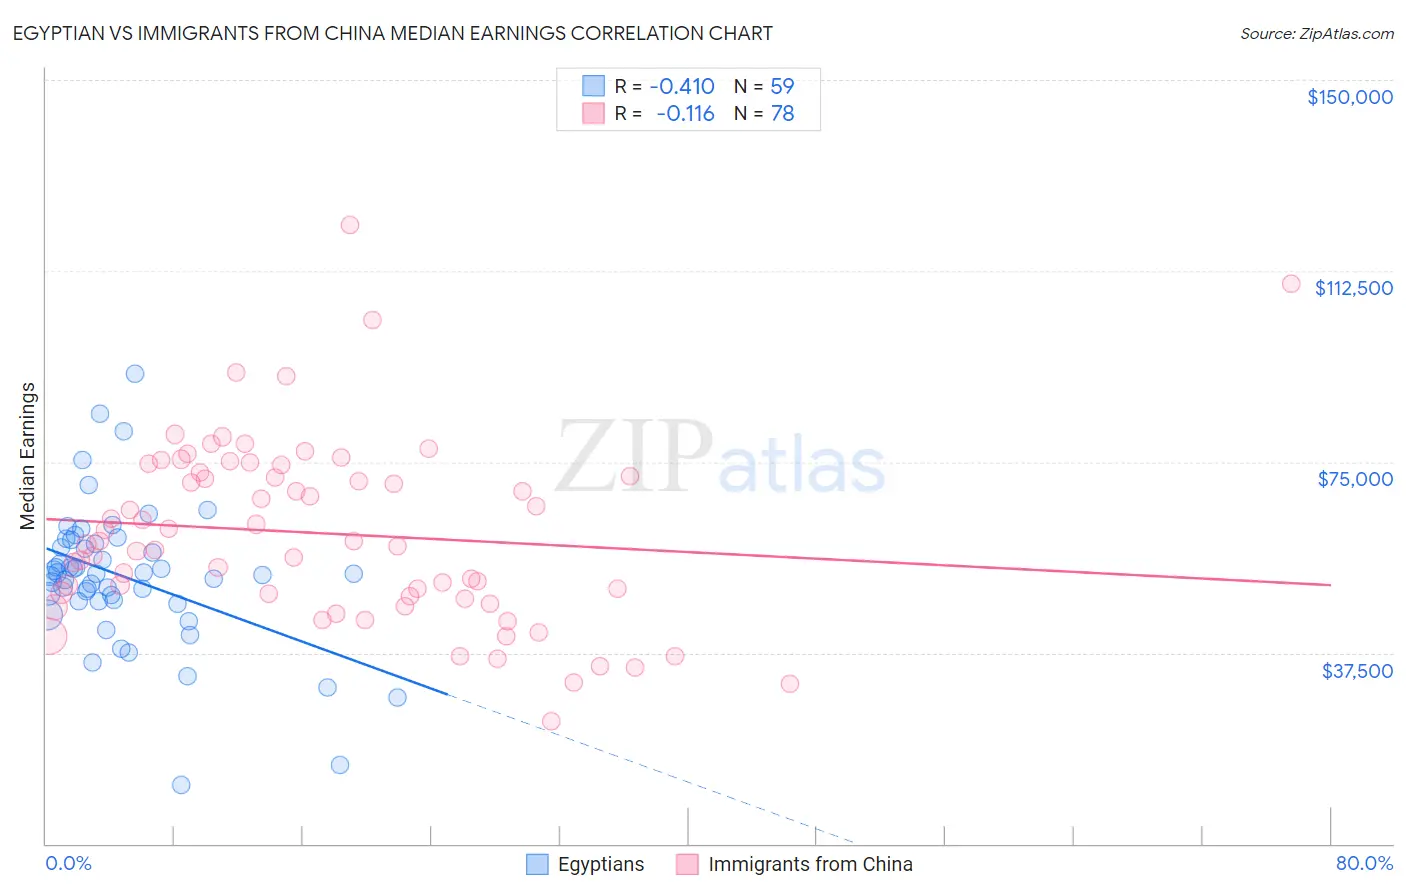
Egyptian vs Immigrants from China Median Earnings Correlation Chart
The statistical analysis conducted on geographies consisting of 276,931,355 people shows a moderate negative correlation between the proportion of Egyptians and median earnings in the United States with a correlation coefficient (R) of -0.410 and weighted average of $51,701. Similarly, the statistical analysis conducted on geographies consisting of 457,063,643 people shows a poor negative correlation between the proportion of Immigrants from China and median earnings in the United States with a correlation coefficient (R) of -0.116 and weighted average of $56,638, a difference of 9.6%.
Median Earnings Correlation Summary
| Measurement | Egyptian | Immigrants from China |
| Minimum | $11,442 | $23,942 |
| Maximum | $92,200 | $121,459 |
| Range | $80,758 | $97,517 |
| Mean | $52,434 | $60,963 |
| Median | $52,906 | $59,099 |
| Interquartile 25% (IQ1) | $47,712 | $48,648 |
| Interquartile 75% (IQ3) | $58,933 | $73,028 |
| Interquartile Range (IQR) | $11,221 | $24,380 |
| Standard Deviation (Sample) | $13,766 | $18,079 |
| Standard Deviation (Population) | $13,649 | $17,962 |
Similar Demographics by Median Earnings
Demographics Similar to Egyptians by Median Earnings
In terms of median earnings, the demographic groups most similar to Egyptians are Immigrants from Pakistan ($51,693, a difference of 0.010%), Immigrants from Indonesia ($51,715, a difference of 0.030%), Immigrants from Norway ($51,758, a difference of 0.11%), Estonian ($51,772, a difference of 0.14%), and Immigrants from Eastern Europe ($51,624, a difference of 0.15%).
| Demographics | Rating | Rank | Median Earnings |
| Immigrants | Europe | 100.0 /100 | #48 | Exceptional $52,195 |
| Bolivians | 100.0 /100 | #49 | Exceptional $52,005 |
| Immigrants | South Africa | 100.0 /100 | #50 | Exceptional $51,850 |
| Immigrants | Austria | 99.9 /100 | #51 | Exceptional $51,826 |
| Estonians | 99.9 /100 | #52 | Exceptional $51,772 |
| Immigrants | Norway | 99.9 /100 | #53 | Exceptional $51,758 |
| Immigrants | Indonesia | 99.9 /100 | #54 | Exceptional $51,715 |
| Egyptians | 99.9 /100 | #55 | Exceptional $51,701 |
| Immigrants | Pakistan | 99.9 /100 | #56 | Exceptional $51,693 |
| Immigrants | Eastern Europe | 99.9 /100 | #57 | Exceptional $51,624 |
| Immigrants | Bolivia | 99.9 /100 | #58 | Exceptional $51,605 |
| Immigrants | Croatia | 99.9 /100 | #59 | Exceptional $51,581 |
| Immigrants | Serbia | 99.9 /100 | #60 | Exceptional $51,557 |
| Immigrants | Latvia | 99.9 /100 | #61 | Exceptional $51,555 |
| Immigrants | Romania | 99.9 /100 | #62 | Exceptional $51,337 |
Demographics Similar to Immigrants from China by Median Earnings
In terms of median earnings, the demographic groups most similar to Immigrants from China are Immigrants from Ireland ($56,854, a difference of 0.38%), Immigrants from Australia ($56,305, a difference of 0.59%), Indian (Asian) ($56,253, a difference of 0.68%), Immigrants from Israel ($57,034, a difference of 0.70%), and Immigrants from Eastern Asia ($56,183, a difference of 0.81%).
| Demographics | Rating | Rank | Median Earnings |
| Immigrants | Singapore | 100.0 /100 | #6 | Exceptional $59,038 |
| Iranians | 100.0 /100 | #7 | Exceptional $58,474 |
| Immigrants | Iran | 100.0 /100 | #8 | Exceptional $57,612 |
| Okinawans | 100.0 /100 | #9 | Exceptional $57,550 |
| Immigrants | South Central Asia | 100.0 /100 | #10 | Exceptional $57,114 |
| Immigrants | Israel | 100.0 /100 | #11 | Exceptional $57,034 |
| Immigrants | Ireland | 100.0 /100 | #12 | Exceptional $56,854 |
| Immigrants | China | 100.0 /100 | #13 | Exceptional $56,638 |
| Immigrants | Australia | 100.0 /100 | #14 | Exceptional $56,305 |
| Indians (Asian) | 100.0 /100 | #15 | Exceptional $56,253 |
| Immigrants | Eastern Asia | 100.0 /100 | #16 | Exceptional $56,183 |
| Eastern Europeans | 100.0 /100 | #17 | Exceptional $55,084 |
| Immigrants | Japan | 100.0 /100 | #18 | Exceptional $54,938 |
| Immigrants | Belgium | 100.0 /100 | #19 | Exceptional $54,679 |
| Cypriots | 100.0 /100 | #20 | Exceptional $54,589 |