Danish vs Nepalese Disability Age Over 75
COMPARE
Danish
Nepalese
Disability Age Over 75
Disability Age Over 75 Comparison
Danes
Nepalese
46.2%
DISABILITY AGE OVER 75
98.6/ 100
METRIC RATING
87th/ 347
METRIC RANK
52.6%
DISABILITY AGE OVER 75
0.0/ 100
METRIC RATING
327th/ 347
METRIC RANK
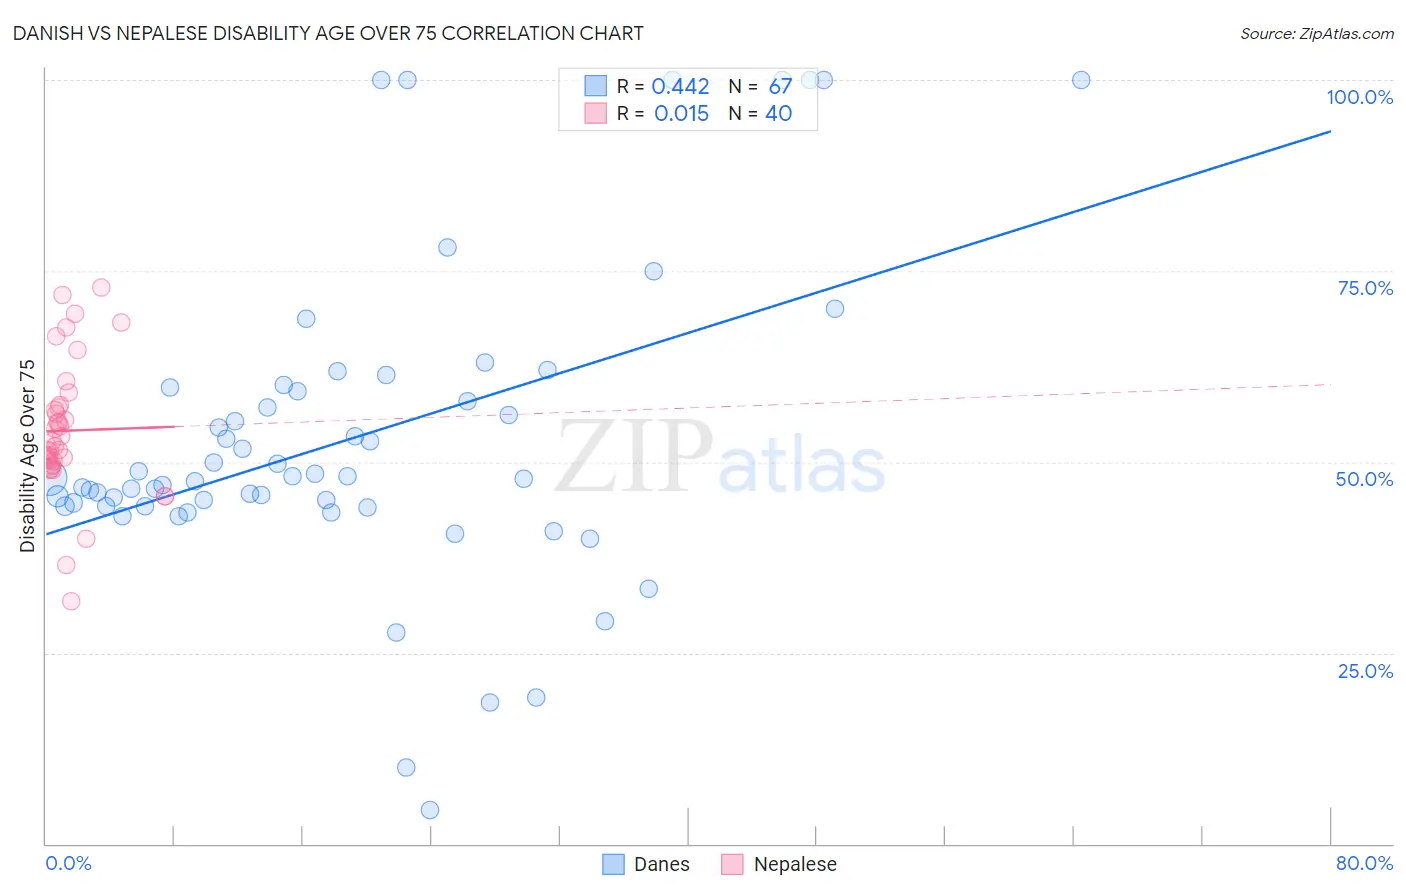
Danish vs Nepalese Disability Age Over 75 Correlation Chart
The statistical analysis conducted on geographies consisting of 473,146,755 people shows a moderate positive correlation between the proportion of Danes and percentage of population with a disability over the age of 75 in the United States with a correlation coefficient (R) of 0.442 and weighted average of 46.2%. Similarly, the statistical analysis conducted on geographies consisting of 24,521,755 people shows no correlation between the proportion of Nepalese and percentage of population with a disability over the age of 75 in the United States with a correlation coefficient (R) of 0.015 and weighted average of 52.6%, a difference of 13.8%.
Disability Age Over 75 Correlation Summary
| Measurement | Danish | Nepalese |
| Minimum | 4.4% | 31.7% |
| Maximum | 100.0% | 72.9% |
| Range | 95.6% | 41.1% |
| Mean | 53.1% | 54.1% |
| Median | 47.9% | 52.3% |
| Interquartile 25% (IQ1) | 44.1% | 49.8% |
| Interquartile 75% (IQ3) | 59.7% | 57.3% |
| Interquartile Range (IQR) | 15.6% | 7.5% |
| Standard Deviation (Sample) | 20.5% | 8.8% |
| Standard Deviation (Population) | 20.4% | 8.7% |
Similar Demographics by Disability Age Over 75
Demographics Similar to Danes by Disability Age Over 75
In terms of disability age over 75, the demographic groups most similar to Danes are Romanian (46.2%, a difference of 0.0%), Immigrants from Southern Europe (46.2%, a difference of 0.010%), Immigrants from Jordan (46.2%, a difference of 0.020%), Immigrants from Latvia (46.2%, a difference of 0.040%), and Argentinean (46.2%, a difference of 0.040%).
| Demographics | Rating | Rank | Disability Age Over 75 |
| Soviet Union | 98.8 /100 | #80 | Exceptional 46.2% |
| New Zealanders | 98.8 /100 | #81 | Exceptional 46.2% |
| Immigrants | Latvia | 98.7 /100 | #82 | Exceptional 46.2% |
| Argentineans | 98.7 /100 | #83 | Exceptional 46.2% |
| Immigrants | Jordan | 98.7 /100 | #84 | Exceptional 46.2% |
| Immigrants | Southern Europe | 98.6 /100 | #85 | Exceptional 46.2% |
| Romanians | 98.6 /100 | #86 | Exceptional 46.2% |
| Danes | 98.6 /100 | #87 | Exceptional 46.2% |
| Uruguayans | 98.4 /100 | #88 | Exceptional 46.2% |
| Immigrants | Saudi Arabia | 98.4 /100 | #89 | Exceptional 46.3% |
| Northern Europeans | 98.3 /100 | #90 | Exceptional 46.3% |
| Immigrants | Egypt | 98.3 /100 | #91 | Exceptional 46.3% |
| Germans | 98.2 /100 | #92 | Exceptional 46.3% |
| Ugandans | 98.2 /100 | #93 | Exceptional 46.3% |
| Albanians | 98.1 /100 | #94 | Exceptional 46.3% |
Demographics Similar to Nepalese by Disability Age Over 75
In terms of disability age over 75, the demographic groups most similar to Nepalese are Ute (52.6%, a difference of 0.030%), Choctaw (52.7%, a difference of 0.19%), Immigrants from Cabo Verde (52.4%, a difference of 0.38%), Alaska Native (52.8%, a difference of 0.41%), and Menominee (52.3%, a difference of 0.54%).
| Demographics | Rating | Rank | Disability Age Over 75 |
| Paiute | 0.0 /100 | #320 | Tragic 51.5% |
| Dutch West Indians | 0.0 /100 | #321 | Tragic 51.5% |
| Comanche | 0.0 /100 | #322 | Tragic 51.7% |
| Immigrants | Yemen | 0.0 /100 | #323 | Tragic 52.0% |
| Menominee | 0.0 /100 | #324 | Tragic 52.3% |
| Immigrants | Cabo Verde | 0.0 /100 | #325 | Tragic 52.4% |
| Ute | 0.0 /100 | #326 | Tragic 52.6% |
| Nepalese | 0.0 /100 | #327 | Tragic 52.6% |
| Choctaw | 0.0 /100 | #328 | Tragic 52.7% |
| Alaska Natives | 0.0 /100 | #329 | Tragic 52.8% |
| Puerto Ricans | 0.0 /100 | #330 | Tragic 52.9% |
| Hopi | 0.0 /100 | #331 | Tragic 52.9% |
| Natives/Alaskans | 0.0 /100 | #332 | Tragic 53.1% |
| Apache | 0.0 /100 | #333 | Tragic 53.6% |
| Alaskan Athabascans | 0.0 /100 | #334 | Tragic 54.0% |