Immigrants from Hong Kong vs Nepalese Per Capita Income
COMPARE
Immigrants from Hong Kong
Nepalese
Per Capita Income
Per Capita Income Comparison
Immigrants from Hong Kong
Nepalese
$56,709
PER CAPITA INCOME
100.0/ 100
METRIC RATING
8th/ 347
METRIC RANK
$38,442
PER CAPITA INCOME
0.3/ 100
METRIC RATING
273rd/ 347
METRIC RANK
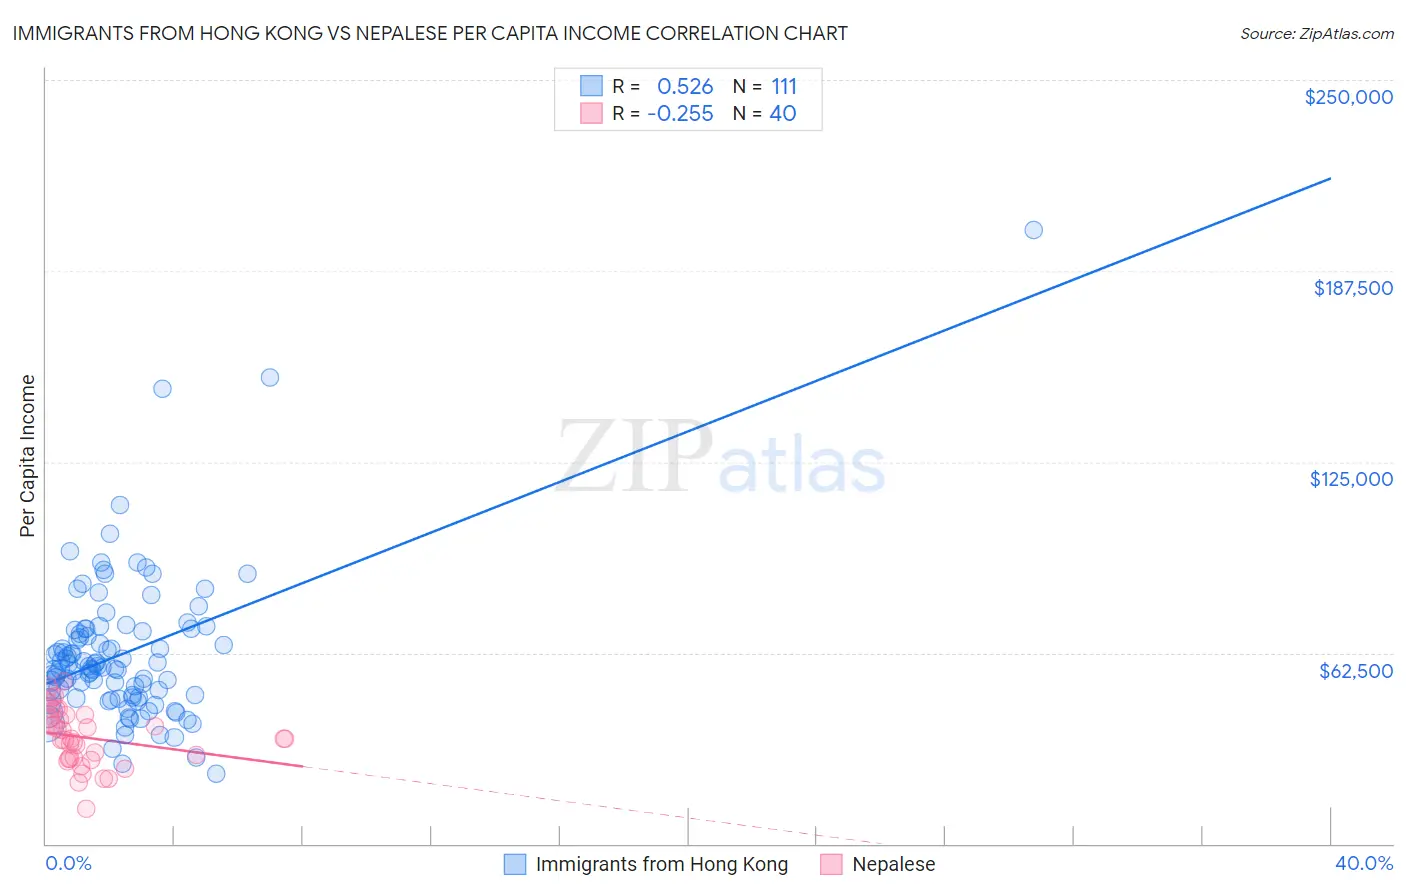
Immigrants from Hong Kong vs Nepalese Per Capita Income Correlation Chart
The statistical analysis conducted on geographies consisting of 253,979,312 people shows a substantial positive correlation between the proportion of Immigrants from Hong Kong and per capita income in the United States with a correlation coefficient (R) of 0.526 and weighted average of $56,709. Similarly, the statistical analysis conducted on geographies consisting of 24,521,755 people shows a weak negative correlation between the proportion of Nepalese and per capita income in the United States with a correlation coefficient (R) of -0.255 and weighted average of $38,442, a difference of 47.5%.
Per Capita Income Correlation Summary
| Measurement | Immigrants from Hong Kong | Nepalese |
| Minimum | $23,001 | $11,464 |
| Maximum | $200,879 | $53,263 |
| Range | $177,878 | $41,799 |
| Mean | $62,312 | $34,718 |
| Median | $57,767 | $34,262 |
| Interquartile 25% (IQ1) | $47,777 | $28,014 |
| Interquartile 75% (IQ3) | $69,849 | $41,612 |
| Interquartile Range (IQR) | $22,072 | $13,598 |
| Standard Deviation (Sample) | $24,374 | $9,316 |
| Standard Deviation (Population) | $24,264 | $9,199 |
Similar Demographics by Per Capita Income
Demographics Similar to Immigrants from Hong Kong by Per Capita Income
In terms of per capita income, the demographic groups most similar to Immigrants from Hong Kong are Immigrants from Ireland ($56,584, a difference of 0.22%), Immigrants from Israel ($57,384, a difference of 1.2%), Okinawan ($55,817, a difference of 1.6%), Eastern European ($55,780, a difference of 1.7%), and Immigrants from Taiwan ($57,742, a difference of 1.8%).
| Demographics | Rating | Rank | Per Capita Income |
| Filipinos | 100.0 /100 | #1 | Exceptional $59,066 |
| Iranians | 100.0 /100 | #2 | Exceptional $58,786 |
| Immigrants | Singapore | 100.0 /100 | #3 | Exceptional $58,353 |
| Immigrants | Australia | 100.0 /100 | #4 | Exceptional $57,953 |
| Immigrants | Iran | 100.0 /100 | #5 | Exceptional $57,759 |
| Immigrants | Taiwan | 100.0 /100 | #6 | Exceptional $57,742 |
| Immigrants | Israel | 100.0 /100 | #7 | Exceptional $57,384 |
| Immigrants | Hong Kong | 100.0 /100 | #8 | Exceptional $56,709 |
| Immigrants | Ireland | 100.0 /100 | #9 | Exceptional $56,584 |
| Okinawans | 100.0 /100 | #10 | Exceptional $55,817 |
| Eastern Europeans | 100.0 /100 | #11 | Exceptional $55,780 |
| Immigrants | Sweden | 100.0 /100 | #12 | Exceptional $55,582 |
| Immigrants | India | 100.0 /100 | #13 | Exceptional $55,268 |
| Immigrants | Belgium | 100.0 /100 | #14 | Exceptional $55,082 |
| Cypriots | 100.0 /100 | #15 | Exceptional $54,899 |
Demographics Similar to Nepalese by Per Capita Income
In terms of per capita income, the demographic groups most similar to Nepalese are Immigrants from El Salvador ($38,394, a difference of 0.13%), Immigrants from Cabo Verde ($38,540, a difference of 0.25%), Central American ($38,560, a difference of 0.31%), Immigrants from Belize ($38,614, a difference of 0.45%), and Immigrants from Liberia ($38,165, a difference of 0.73%).
| Demographics | Rating | Rank | Per Capita Income |
| Salvadorans | 0.5 /100 | #266 | Tragic $38,858 |
| Immigrants | Zaire | 0.4 /100 | #267 | Tragic $38,848 |
| Liberians | 0.4 /100 | #268 | Tragic $38,780 |
| Immigrants | Jamaica | 0.4 /100 | #269 | Tragic $38,766 |
| Immigrants | Belize | 0.3 /100 | #270 | Tragic $38,614 |
| Central Americans | 0.3 /100 | #271 | Tragic $38,560 |
| Immigrants | Cabo Verde | 0.3 /100 | #272 | Tragic $38,540 |
| Nepalese | 0.3 /100 | #273 | Tragic $38,442 |
| Immigrants | El Salvador | 0.3 /100 | #274 | Tragic $38,394 |
| Immigrants | Liberia | 0.2 /100 | #275 | Tragic $38,165 |
| Hmong | 0.2 /100 | #276 | Tragic $38,120 |
| Comanche | 0.2 /100 | #277 | Tragic $38,088 |
| Immigrants | Nicaragua | 0.2 /100 | #278 | Tragic $38,065 |
| Colville | 0.2 /100 | #279 | Tragic $38,047 |
| Potawatomi | 0.2 /100 | #280 | Tragic $38,046 |