Danish vs Nepalese Unemployment
COMPARE
Danish
Nepalese
Unemployment
Unemployment Comparison
Danes
Nepalese
4.3%
UNEMPLOYMENT
100.0/ 100
METRIC RATING
4th/ 347
METRIC RANK
6.2%
UNEMPLOYMENT
0.0/ 100
METRIC RATING
287th/ 347
METRIC RANK
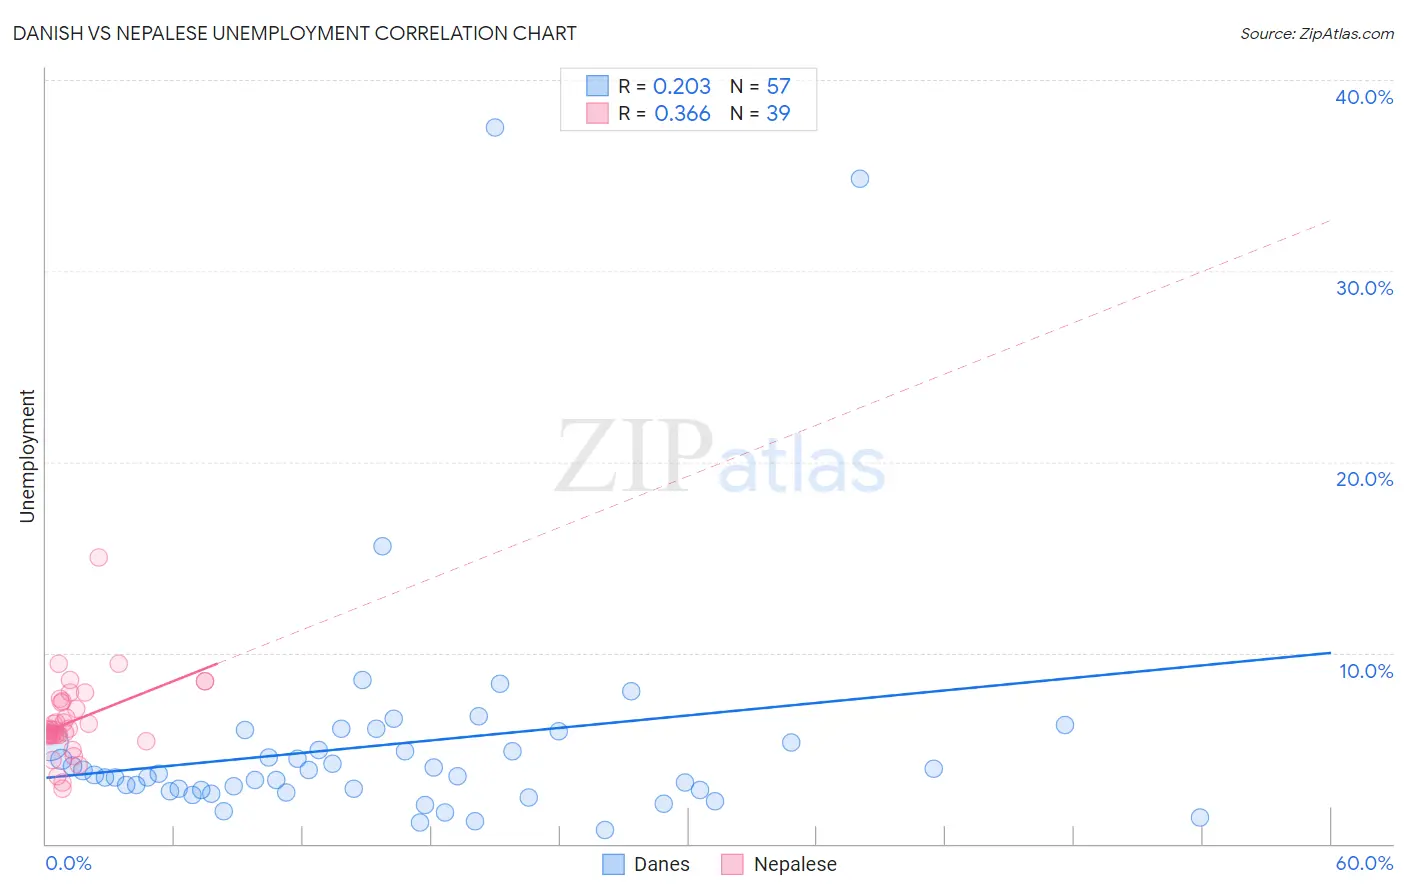
Danish vs Nepalese Unemployment Correlation Chart
The statistical analysis conducted on geographies consisting of 472,550,686 people shows a weak positive correlation between the proportion of Danes and unemployment in the United States with a correlation coefficient (R) of 0.203 and weighted average of 4.3%. Similarly, the statistical analysis conducted on geographies consisting of 24,519,269 people shows a mild positive correlation between the proportion of Nepalese and unemployment in the United States with a correlation coefficient (R) of 0.366 and weighted average of 6.2%, a difference of 42.0%.
Unemployment Correlation Summary
| Measurement | Danish | Nepalese |
| Minimum | 0.70% | 2.9% |
| Maximum | 37.5% | 15.0% |
| Range | 36.8% | 12.1% |
| Mean | 5.2% | 6.4% |
| Median | 3.6% | 6.0% |
| Interquartile 25% (IQ1) | 2.8% | 5.7% |
| Interquartile 75% (IQ3) | 5.3% | 7.5% |
| Interquartile Range (IQR) | 2.5% | 1.8% |
| Standard Deviation (Sample) | 6.4% | 2.1% |
| Standard Deviation (Population) | 6.3% | 2.1% |
Similar Demographics by Unemployment
Demographics Similar to Danes by Unemployment
In terms of unemployment, the demographic groups most similar to Danes are Czech (4.3%, a difference of 0.15%), Luxembourger (4.3%, a difference of 0.25%), Swedish (4.4%, a difference of 2.3%), German (4.5%, a difference of 3.1%), and Norwegian (4.2%, a difference of 3.6%).
| Demographics | Rating | Rank | Unemployment |
| Norwegians | 100.0 /100 | #1 | Exceptional 4.2% |
| Luxembourgers | 100.0 /100 | #2 | Exceptional 4.3% |
| Czechs | 100.0 /100 | #3 | Exceptional 4.3% |
| Danes | 100.0 /100 | #4 | Exceptional 4.3% |
| Swedes | 100.0 /100 | #5 | Exceptional 4.4% |
| Germans | 100.0 /100 | #6 | Exceptional 4.5% |
| Immigrants | India | 100.0 /100 | #7 | Exceptional 4.5% |
| Swiss | 100.0 /100 | #8 | Exceptional 4.5% |
| Scandinavians | 100.0 /100 | #9 | Exceptional 4.5% |
| Dutch | 100.0 /100 | #10 | Exceptional 4.6% |
| English | 100.0 /100 | #11 | Exceptional 4.6% |
| Pennsylvania Germans | 100.0 /100 | #12 | Exceptional 4.6% |
| Belgians | 100.0 /100 | #13 | Exceptional 4.6% |
| Immigrants | Cuba | 100.0 /100 | #14 | Exceptional 4.6% |
| Europeans | 99.9 /100 | #15 | Exceptional 4.6% |
Demographics Similar to Nepalese by Unemployment
In terms of unemployment, the demographic groups most similar to Nepalese are Ecuadorian (6.2%, a difference of 0.030%), Immigrants from Caribbean (6.2%, a difference of 0.33%), Chippewa (6.2%, a difference of 0.38%), Senegalese (6.2%, a difference of 0.47%), and Immigrants from Senegal (6.1%, a difference of 0.76%).
| Demographics | Rating | Rank | Unemployment |
| Immigrants | Western Africa | 0.0 /100 | #280 | Tragic 6.0% |
| Africans | 0.0 /100 | #281 | Tragic 6.1% |
| Immigrants | Azores | 0.0 /100 | #282 | Tragic 6.1% |
| Immigrants | Ghana | 0.0 /100 | #283 | Tragic 6.1% |
| Aleuts | 0.0 /100 | #284 | Tragic 6.1% |
| Immigrants | Senegal | 0.0 /100 | #285 | Tragic 6.1% |
| Immigrants | Caribbean | 0.0 /100 | #286 | Tragic 6.2% |
| Nepalese | 0.0 /100 | #287 | Tragic 6.2% |
| Ecuadorians | 0.0 /100 | #288 | Tragic 6.2% |
| Chippewa | 0.0 /100 | #289 | Tragic 6.2% |
| Senegalese | 0.0 /100 | #290 | Tragic 6.2% |
| Haitians | 0.0 /100 | #291 | Tragic 6.2% |
| Central American Indians | 0.0 /100 | #292 | Tragic 6.2% |
| Immigrants | Ecuador | 0.0 /100 | #293 | Tragic 6.2% |
| Spanish American Indians | 0.0 /100 | #294 | Tragic 6.2% |