Immigrants from Norway vs Immigrants from Morocco Per Capita Income
COMPARE
Immigrants from Norway
Immigrants from Morocco
Per Capita Income
Per Capita Income Comparison
Immigrants from Norway
Immigrants from Morocco
$52,217
PER CAPITA INCOME
100.0/ 100
METRIC RATING
32nd/ 347
METRIC RANK
$46,430
PER CAPITA INCOME
95.7/ 100
METRIC RATING
112th/ 347
METRIC RANK
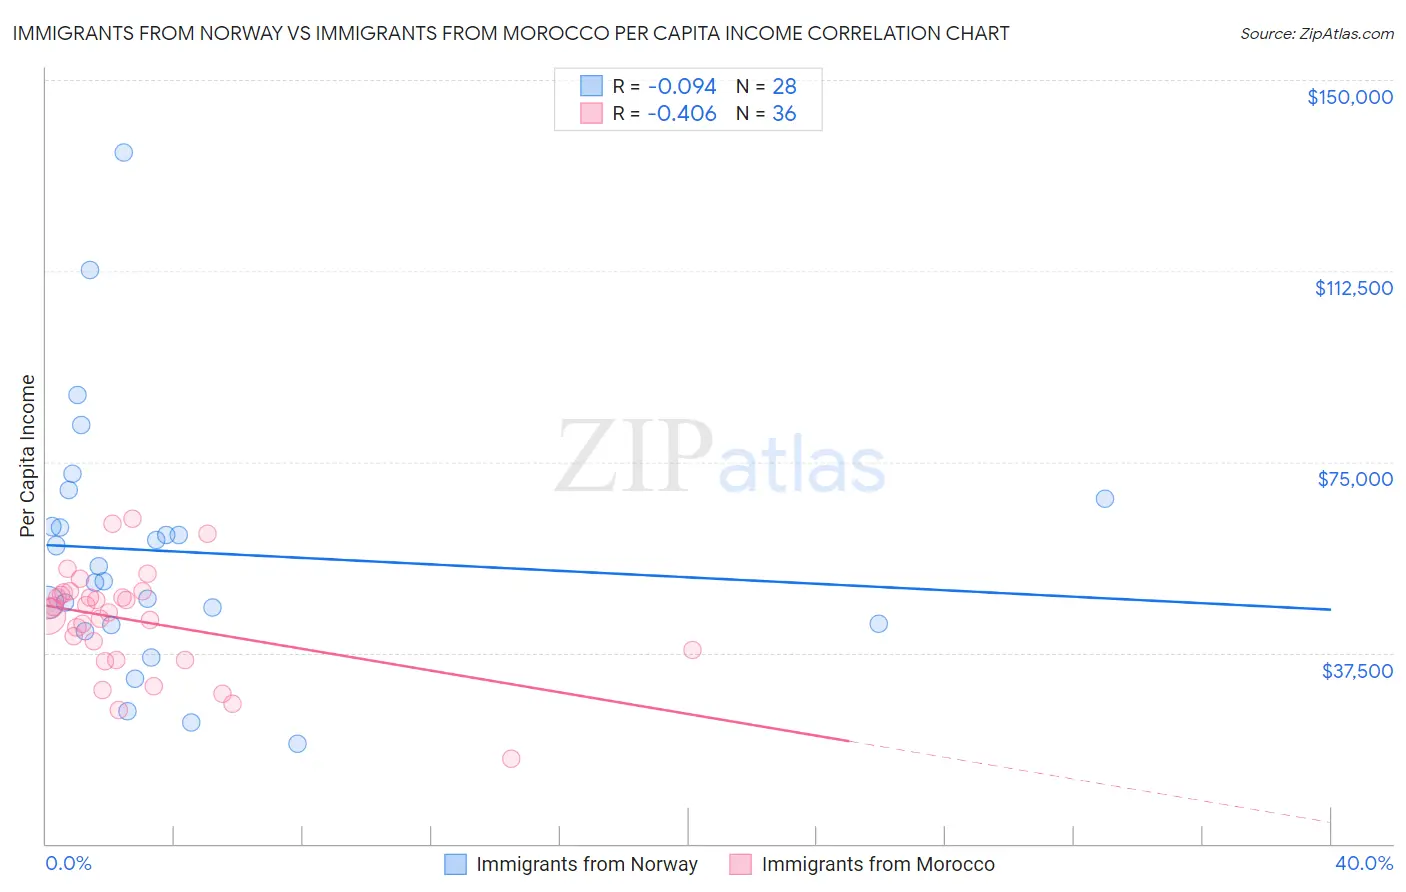
Immigrants from Norway vs Immigrants from Morocco Per Capita Income Correlation Chart
The statistical analysis conducted on geographies consisting of 116,714,031 people shows a slight negative correlation between the proportion of Immigrants from Norway and per capita income in the United States with a correlation coefficient (R) of -0.094 and weighted average of $52,217. Similarly, the statistical analysis conducted on geographies consisting of 178,911,890 people shows a moderate negative correlation between the proportion of Immigrants from Morocco and per capita income in the United States with a correlation coefficient (R) of -0.406 and weighted average of $46,430, a difference of 12.5%.
Per Capita Income Correlation Summary
| Measurement | Immigrants from Norway | Immigrants from Morocco |
| Minimum | $19,734 | $16,654 |
| Maximum | $135,828 | $63,792 |
| Range | $116,094 | $47,138 |
| Mean | $57,343 | $43,757 |
| Median | $53,027 | $45,863 |
| Interquartile 25% (IQ1) | $43,092 | $36,958 |
| Interquartile 75% (IQ3) | $65,016 | $49,075 |
| Interquartile Range (IQR) | $21,924 | $12,117 |
| Standard Deviation (Sample) | $25,135 | $10,240 |
| Standard Deviation (Population) | $24,682 | $10,097 |
Similar Demographics by Per Capita Income
Demographics Similar to Immigrants from Norway by Per Capita Income
In terms of per capita income, the demographic groups most similar to Immigrants from Norway are Australian ($52,074, a difference of 0.27%), Turkish ($52,391, a difference of 0.33%), Immigrants from Russia ($52,044, a difference of 0.33%), Burmese ($52,005, a difference of 0.41%), and Immigrants from Austria ($52,503, a difference of 0.55%).
| Demographics | Rating | Rank | Per Capita Income |
| Immigrants | Japan | 100.0 /100 | #25 | Exceptional $53,359 |
| Russians | 100.0 /100 | #26 | Exceptional $53,154 |
| Immigrants | South Central Asia | 100.0 /100 | #27 | Exceptional $52,660 |
| Latvians | 100.0 /100 | #28 | Exceptional $52,649 |
| Israelis | 100.0 /100 | #29 | Exceptional $52,596 |
| Immigrants | Austria | 100.0 /100 | #30 | Exceptional $52,503 |
| Turks | 100.0 /100 | #31 | Exceptional $52,391 |
| Immigrants | Norway | 100.0 /100 | #32 | Exceptional $52,217 |
| Australians | 100.0 /100 | #33 | Exceptional $52,074 |
| Immigrants | Russia | 100.0 /100 | #34 | Exceptional $52,044 |
| Burmese | 100.0 /100 | #35 | Exceptional $52,005 |
| Immigrants | Greece | 100.0 /100 | #36 | Exceptional $51,891 |
| Estonians | 100.0 /100 | #37 | Exceptional $51,875 |
| Immigrants | Czechoslovakia | 100.0 /100 | #38 | Exceptional $51,770 |
| Cambodians | 100.0 /100 | #39 | Exceptional $51,731 |
Demographics Similar to Immigrants from Morocco by Per Capita Income
In terms of per capita income, the demographic groups most similar to Immigrants from Morocco are Taiwanese ($46,455, a difference of 0.050%), Chilean ($46,459, a difference of 0.060%), Immigrants from Albania ($46,387, a difference of 0.090%), Immigrants from Northern Africa ($46,531, a difference of 0.22%), and Immigrants from Kuwait ($46,543, a difference of 0.24%).
| Demographics | Rating | Rank | Per Capita Income |
| British | 96.3 /100 | #105 | Exceptional $46,571 |
| Ethiopians | 96.3 /100 | #106 | Exceptional $46,569 |
| Serbians | 96.2 /100 | #107 | Exceptional $46,551 |
| Immigrants | Kuwait | 96.2 /100 | #108 | Exceptional $46,543 |
| Immigrants | Northern Africa | 96.2 /100 | #109 | Exceptional $46,531 |
| Chileans | 95.9 /100 | #110 | Exceptional $46,459 |
| Taiwanese | 95.8 /100 | #111 | Exceptional $46,455 |
| Immigrants | Morocco | 95.7 /100 | #112 | Exceptional $46,430 |
| Immigrants | Albania | 95.5 /100 | #113 | Exceptional $46,387 |
| Afghans | 94.9 /100 | #114 | Exceptional $46,268 |
| Immigrants | Chile | 94.6 /100 | #115 | Exceptional $46,213 |
| Poles | 94.1 /100 | #116 | Exceptional $46,123 |
| Chinese | 93.9 /100 | #117 | Exceptional $46,098 |
| Immigrants | Saudi Arabia | 93.3 /100 | #118 | Exceptional $46,008 |
| Immigrants | Poland | 93.1 /100 | #119 | Exceptional $45,979 |