Alaska Native vs Immigrants from Morocco Per Capita Income
COMPARE
Alaska Native
Immigrants from Morocco
Per Capita Income
Per Capita Income Comparison
Alaska Natives
Immigrants from Morocco
$39,558
PER CAPITA INCOME
1.0/ 100
METRIC RATING
254th/ 347
METRIC RANK
$46,430
PER CAPITA INCOME
95.7/ 100
METRIC RATING
112th/ 347
METRIC RANK
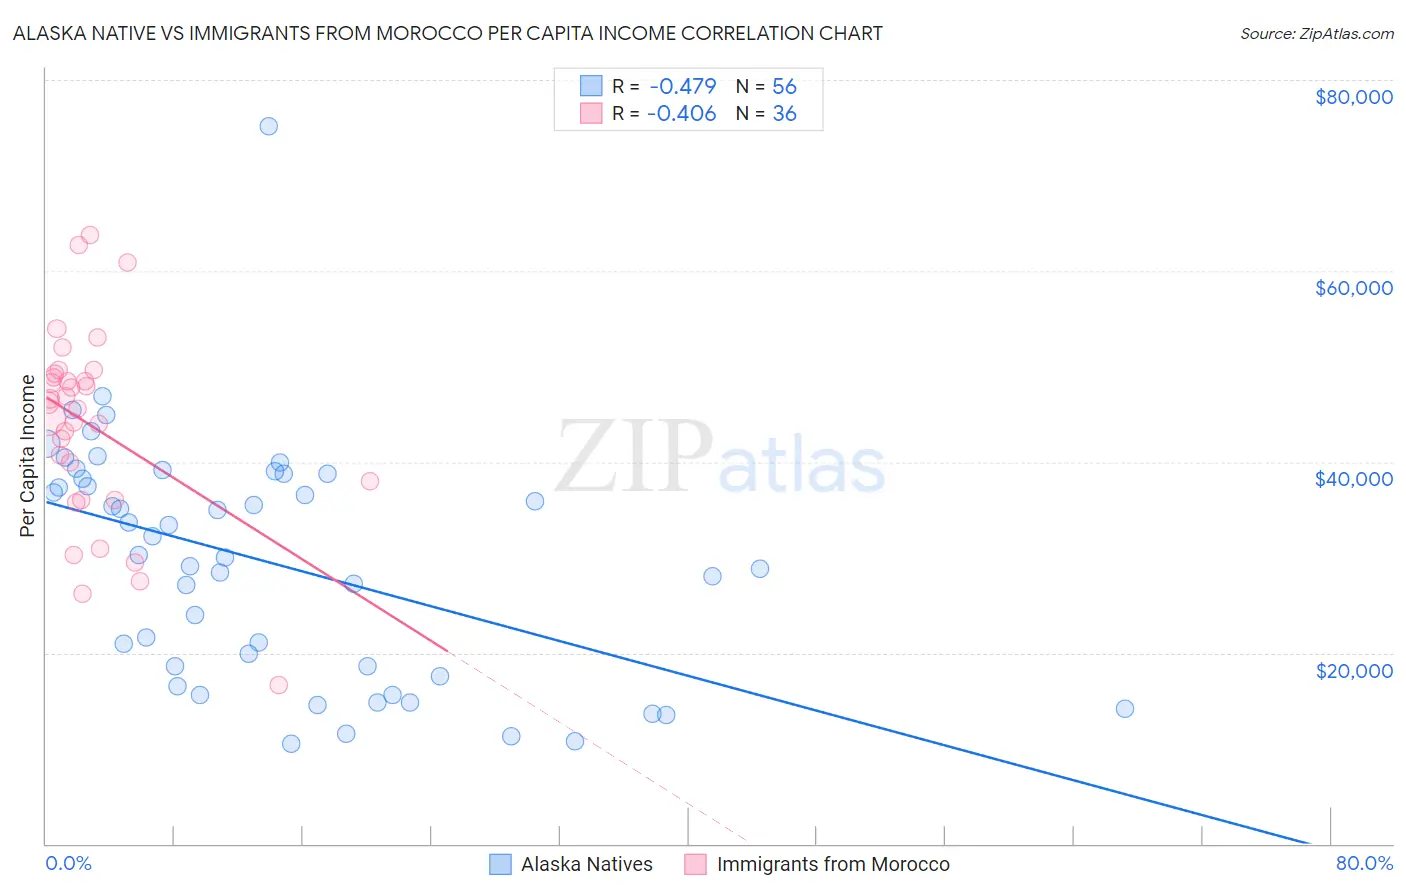
Alaska Native vs Immigrants from Morocco Per Capita Income Correlation Chart
The statistical analysis conducted on geographies consisting of 76,776,237 people shows a moderate negative correlation between the proportion of Alaska Natives and per capita income in the United States with a correlation coefficient (R) of -0.479 and weighted average of $39,558. Similarly, the statistical analysis conducted on geographies consisting of 178,911,890 people shows a moderate negative correlation between the proportion of Immigrants from Morocco and per capita income in the United States with a correlation coefficient (R) of -0.406 and weighted average of $46,430, a difference of 17.4%.
Per Capita Income Correlation Summary
| Measurement | Alaska Native | Immigrants from Morocco |
| Minimum | $10,456 | $16,654 |
| Maximum | $75,144 | $63,792 |
| Range | $64,688 | $47,138 |
| Mean | $29,356 | $43,757 |
| Median | $30,080 | $45,863 |
| Interquartile 25% (IQ1) | $18,080 | $36,958 |
| Interquartile 75% (IQ3) | $38,478 | $49,075 |
| Interquartile Range (IQR) | $20,399 | $12,117 |
| Standard Deviation (Sample) | $12,502 | $10,240 |
| Standard Deviation (Population) | $12,390 | $10,097 |
Similar Demographics by Per Capita Income
Demographics Similar to Alaska Natives by Per Capita Income
In terms of per capita income, the demographic groups most similar to Alaska Natives are Osage ($39,568, a difference of 0.020%), Immigrants from Middle Africa ($39,529, a difference of 0.070%), Immigrants from the Azores ($39,608, a difference of 0.13%), Hawaiian ($39,403, a difference of 0.39%), and Nicaraguan ($39,372, a difference of 0.47%).
| Demographics | Rating | Rank | Per Capita Income |
| Immigrants | Somalia | 1.6 /100 | #247 | Tragic $39,974 |
| Cape Verdeans | 1.5 /100 | #248 | Tragic $39,935 |
| Japanese | 1.4 /100 | #249 | Tragic $39,870 |
| Immigrants | Burma/Myanmar | 1.3 /100 | #250 | Tragic $39,827 |
| Samoans | 1.3 /100 | #251 | Tragic $39,826 |
| Immigrants | Azores | 1.0 /100 | #252 | Tragic $39,608 |
| Osage | 1.0 /100 | #253 | Tragic $39,568 |
| Alaska Natives | 1.0 /100 | #254 | Tragic $39,558 |
| Immigrants | Middle Africa | 1.0 /100 | #255 | Tragic $39,529 |
| Hawaiians | 0.8 /100 | #256 | Tragic $39,403 |
| Nicaraguans | 0.8 /100 | #257 | Tragic $39,372 |
| Jamaicans | 0.7 /100 | #258 | Tragic $39,231 |
| Malaysians | 0.7 /100 | #259 | Tragic $39,194 |
| Alaskan Athabascans | 0.6 /100 | #260 | Tragic $39,163 |
| Marshallese | 0.6 /100 | #261 | Tragic $39,108 |
Demographics Similar to Immigrants from Morocco by Per Capita Income
In terms of per capita income, the demographic groups most similar to Immigrants from Morocco are Taiwanese ($46,455, a difference of 0.050%), Chilean ($46,459, a difference of 0.060%), Immigrants from Albania ($46,387, a difference of 0.090%), Immigrants from Northern Africa ($46,531, a difference of 0.22%), and Immigrants from Kuwait ($46,543, a difference of 0.24%).
| Demographics | Rating | Rank | Per Capita Income |
| British | 96.3 /100 | #105 | Exceptional $46,571 |
| Ethiopians | 96.3 /100 | #106 | Exceptional $46,569 |
| Serbians | 96.2 /100 | #107 | Exceptional $46,551 |
| Immigrants | Kuwait | 96.2 /100 | #108 | Exceptional $46,543 |
| Immigrants | Northern Africa | 96.2 /100 | #109 | Exceptional $46,531 |
| Chileans | 95.9 /100 | #110 | Exceptional $46,459 |
| Taiwanese | 95.8 /100 | #111 | Exceptional $46,455 |
| Immigrants | Morocco | 95.7 /100 | #112 | Exceptional $46,430 |
| Immigrants | Albania | 95.5 /100 | #113 | Exceptional $46,387 |
| Afghans | 94.9 /100 | #114 | Exceptional $46,268 |
| Immigrants | Chile | 94.6 /100 | #115 | Exceptional $46,213 |
| Poles | 94.1 /100 | #116 | Exceptional $46,123 |
| Chinese | 93.9 /100 | #117 | Exceptional $46,098 |
| Immigrants | Saudi Arabia | 93.3 /100 | #118 | Exceptional $46,008 |
| Immigrants | Poland | 93.1 /100 | #119 | Exceptional $45,979 |