Kenyan vs Immigrants from Morocco Per Capita Income
COMPARE
Kenyan
Immigrants from Morocco
Per Capita Income
Per Capita Income Comparison
Kenyans
Immigrants from Morocco
$42,808
PER CAPITA INCOME
27.7/ 100
METRIC RATING
190th/ 347
METRIC RANK
$46,430
PER CAPITA INCOME
95.7/ 100
METRIC RATING
112th/ 347
METRIC RANK
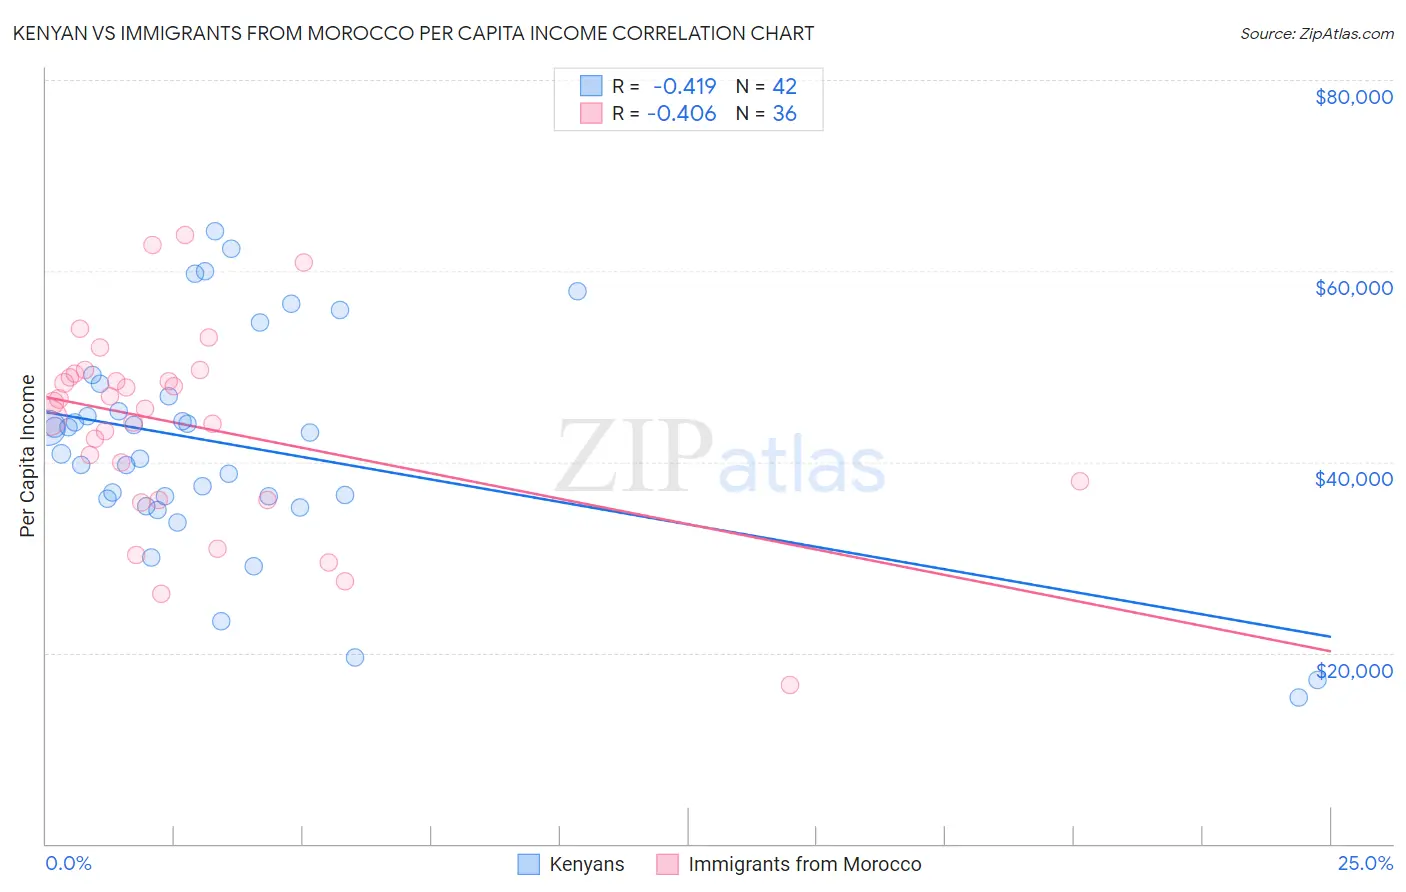
Kenyan vs Immigrants from Morocco Per Capita Income Correlation Chart
The statistical analysis conducted on geographies consisting of 168,245,574 people shows a moderate negative correlation between the proportion of Kenyans and per capita income in the United States with a correlation coefficient (R) of -0.419 and weighted average of $42,808. Similarly, the statistical analysis conducted on geographies consisting of 178,911,890 people shows a moderate negative correlation between the proportion of Immigrants from Morocco and per capita income in the United States with a correlation coefficient (R) of -0.406 and weighted average of $46,430, a difference of 8.5%.
Per Capita Income Correlation Summary
| Measurement | Kenyan | Immigrants from Morocco |
| Minimum | $15,366 | $16,654 |
| Maximum | $64,188 | $63,792 |
| Range | $48,822 | $47,138 |
| Mean | $41,624 | $43,757 |
| Median | $42,003 | $45,863 |
| Interquartile 25% (IQ1) | $36,158 | $36,958 |
| Interquartile 75% (IQ3) | $46,865 | $49,075 |
| Interquartile Range (IQR) | $10,707 | $12,117 |
| Standard Deviation (Sample) | $11,486 | $10,240 |
| Standard Deviation (Population) | $11,348 | $10,097 |
Similar Demographics by Per Capita Income
Demographics Similar to Kenyans by Per Capita Income
In terms of per capita income, the demographic groups most similar to Kenyans are Yugoslavian ($42,792, a difference of 0.040%), Iraqi ($42,760, a difference of 0.11%), Immigrants from Sierra Leone ($42,752, a difference of 0.13%), Bermudan ($42,911, a difference of 0.24%), and Immigrants from Fiji ($42,694, a difference of 0.27%).
| Demographics | Rating | Rank | Per Capita Income |
| Germans | 33.9 /100 | #183 | Fair $43,067 |
| Spaniards | 32.9 /100 | #184 | Fair $43,028 |
| Immigrants | Immigrants | 32.5 /100 | #185 | Fair $43,010 |
| French Canadians | 32.3 /100 | #186 | Fair $43,003 |
| Immigrants | Colombia | 31.5 /100 | #187 | Fair $42,971 |
| Immigrants | Africa | 31.0 /100 | #188 | Fair $42,950 |
| Bermudans | 30.1 /100 | #189 | Fair $42,911 |
| Kenyans | 27.7 /100 | #190 | Fair $42,808 |
| Yugoslavians | 27.4 /100 | #191 | Fair $42,792 |
| Iraqis | 26.7 /100 | #192 | Fair $42,760 |
| Immigrants | Sierra Leone | 26.5 /100 | #193 | Fair $42,752 |
| Immigrants | Fiji | 25.2 /100 | #194 | Fair $42,694 |
| Immigrants | Kenya | 24.5 /100 | #195 | Fair $42,661 |
| Dutch | 23.4 /100 | #196 | Fair $42,605 |
| Scotch-Irish | 22.6 /100 | #197 | Fair $42,563 |
Demographics Similar to Immigrants from Morocco by Per Capita Income
In terms of per capita income, the demographic groups most similar to Immigrants from Morocco are Taiwanese ($46,455, a difference of 0.050%), Chilean ($46,459, a difference of 0.060%), Immigrants from Albania ($46,387, a difference of 0.090%), Immigrants from Northern Africa ($46,531, a difference of 0.22%), and Immigrants from Kuwait ($46,543, a difference of 0.24%).
| Demographics | Rating | Rank | Per Capita Income |
| British | 96.3 /100 | #105 | Exceptional $46,571 |
| Ethiopians | 96.3 /100 | #106 | Exceptional $46,569 |
| Serbians | 96.2 /100 | #107 | Exceptional $46,551 |
| Immigrants | Kuwait | 96.2 /100 | #108 | Exceptional $46,543 |
| Immigrants | Northern Africa | 96.2 /100 | #109 | Exceptional $46,531 |
| Chileans | 95.9 /100 | #110 | Exceptional $46,459 |
| Taiwanese | 95.8 /100 | #111 | Exceptional $46,455 |
| Immigrants | Morocco | 95.7 /100 | #112 | Exceptional $46,430 |
| Immigrants | Albania | 95.5 /100 | #113 | Exceptional $46,387 |
| Afghans | 94.9 /100 | #114 | Exceptional $46,268 |
| Immigrants | Chile | 94.6 /100 | #115 | Exceptional $46,213 |
| Poles | 94.1 /100 | #116 | Exceptional $46,123 |
| Chinese | 93.9 /100 | #117 | Exceptional $46,098 |
| Immigrants | Saudi Arabia | 93.3 /100 | #118 | Exceptional $46,008 |
| Immigrants | Poland | 93.1 /100 | #119 | Exceptional $45,979 |