Sudanese vs Bermudan Per Capita Income
COMPARE
Sudanese
Bermudan
Per Capita Income
Per Capita Income Comparison
Sudanese
Bermudans
$41,695
PER CAPITA INCOME
9.9/ 100
METRIC RATING
215th/ 347
METRIC RANK
$42,911
PER CAPITA INCOME
30.1/ 100
METRIC RATING
189th/ 347
METRIC RANK
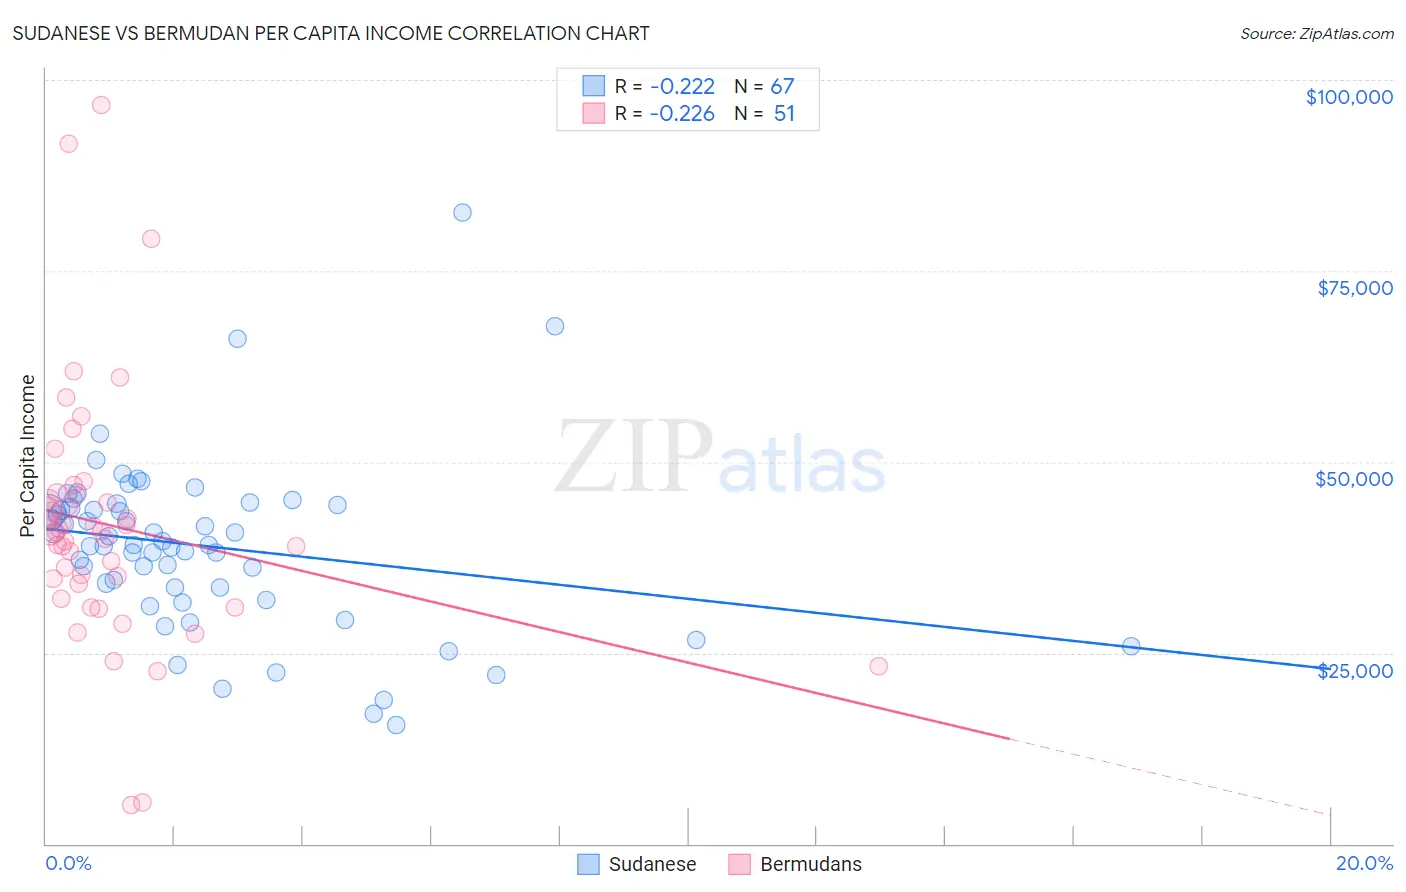
Sudanese vs Bermudan Per Capita Income Correlation Chart
The statistical analysis conducted on geographies consisting of 110,152,165 people shows a weak negative correlation between the proportion of Sudanese and per capita income in the United States with a correlation coefficient (R) of -0.222 and weighted average of $41,695. Similarly, the statistical analysis conducted on geographies consisting of 55,728,704 people shows a weak negative correlation between the proportion of Bermudans and per capita income in the United States with a correlation coefficient (R) of -0.226 and weighted average of $42,911, a difference of 2.9%.
Per Capita Income Correlation Summary
| Measurement | Sudanese | Bermudan |
| Minimum | $15,628 | $4,995 |
| Maximum | $82,685 | $96,710 |
| Range | $67,057 | $91,715 |
| Mean | $38,981 | $41,714 |
| Median | $39,137 | $40,756 |
| Interquartile 25% (IQ1) | $33,494 | $33,973 |
| Interquartile 75% (IQ3) | $44,276 | $45,741 |
| Interquartile Range (IQR) | $10,782 | $11,767 |
| Standard Deviation (Sample) | $11,237 | $16,477 |
| Standard Deviation (Population) | $11,153 | $16,314 |
Similar Demographics by Per Capita Income
Demographics Similar to Sudanese by Per Capita Income
In terms of per capita income, the demographic groups most similar to Sudanese are Tongan ($41,693, a difference of 0.010%), Immigrants from Bangladesh ($41,709, a difference of 0.030%), Guamanian/Chamorro ($41,678, a difference of 0.040%), Immigrants from Venezuela ($41,727, a difference of 0.080%), and Trinidadian and Tobagonian ($41,655, a difference of 0.10%).
| Demographics | Rating | Rank | Per Capita Income |
| Panamanians | 13.9 /100 | #208 | Poor $42,035 |
| Immigrants | Sudan | 13.2 /100 | #209 | Poor $41,986 |
| Ecuadorians | 12.9 /100 | #210 | Poor $41,958 |
| Immigrants | Panama | 11.6 /100 | #211 | Poor $41,853 |
| Immigrants | Senegal | 11.3 /100 | #212 | Poor $41,830 |
| Immigrants | Venezuela | 10.2 /100 | #213 | Poor $41,727 |
| Immigrants | Bangladesh | 10.1 /100 | #214 | Poor $41,709 |
| Sudanese | 9.9 /100 | #215 | Tragic $41,695 |
| Tongans | 9.9 /100 | #216 | Tragic $41,693 |
| Guamanians/Chamorros | 9.7 /100 | #217 | Tragic $41,678 |
| Trinidadians and Tobagonians | 9.5 /100 | #218 | Tragic $41,655 |
| Puget Sound Salish | 8.1 /100 | #219 | Tragic $41,495 |
| Immigrants | Barbados | 7.9 /100 | #220 | Tragic $41,478 |
| Immigrants | Trinidad and Tobago | 7.9 /100 | #221 | Tragic $41,476 |
| Immigrants | Iraq | 7.1 /100 | #222 | Tragic $41,365 |
Demographics Similar to Bermudans by Per Capita Income
In terms of per capita income, the demographic groups most similar to Bermudans are Immigrants from Africa ($42,950, a difference of 0.090%), Immigrants from Colombia ($42,971, a difference of 0.14%), French Canadian ($43,003, a difference of 0.21%), Immigrants ($43,010, a difference of 0.23%), and Kenyan ($42,808, a difference of 0.24%).
| Demographics | Rating | Rank | Per Capita Income |
| Immigrants | Vietnam | 38.1 /100 | #182 | Fair $43,229 |
| Germans | 33.9 /100 | #183 | Fair $43,067 |
| Spaniards | 32.9 /100 | #184 | Fair $43,028 |
| Immigrants | Immigrants | 32.5 /100 | #185 | Fair $43,010 |
| French Canadians | 32.3 /100 | #186 | Fair $43,003 |
| Immigrants | Colombia | 31.5 /100 | #187 | Fair $42,971 |
| Immigrants | Africa | 31.0 /100 | #188 | Fair $42,950 |
| Bermudans | 30.1 /100 | #189 | Fair $42,911 |
| Kenyans | 27.7 /100 | #190 | Fair $42,808 |
| Yugoslavians | 27.4 /100 | #191 | Fair $42,792 |
| Iraqis | 26.7 /100 | #192 | Fair $42,760 |
| Immigrants | Sierra Leone | 26.5 /100 | #193 | Fair $42,752 |
| Immigrants | Fiji | 25.2 /100 | #194 | Fair $42,694 |
| Immigrants | Kenya | 24.5 /100 | #195 | Fair $42,661 |
| Dutch | 23.4 /100 | #196 | Fair $42,605 |