Hmong vs Bermudan Per Capita Income
COMPARE
Hmong
Bermudan
Per Capita Income
Per Capita Income Comparison
Hmong
Bermudans
$38,120
PER CAPITA INCOME
0.2/ 100
METRIC RATING
276th/ 347
METRIC RANK
$42,911
PER CAPITA INCOME
30.1/ 100
METRIC RATING
189th/ 347
METRIC RANK
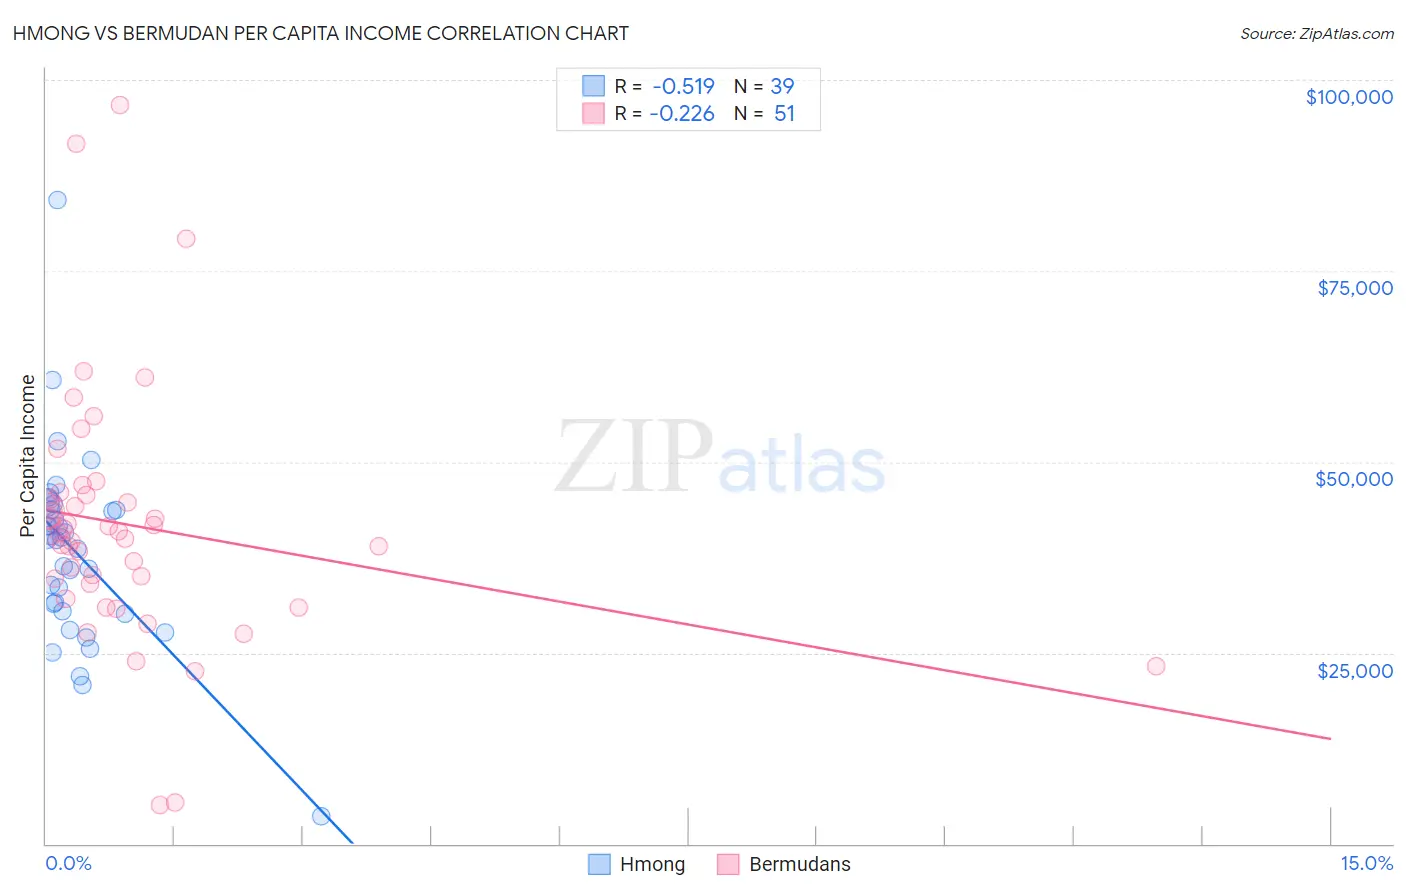
Hmong vs Bermudan Per Capita Income Correlation Chart
The statistical analysis conducted on geographies consisting of 24,672,334 people shows a substantial negative correlation between the proportion of Hmong and per capita income in the United States with a correlation coefficient (R) of -0.519 and weighted average of $38,120. Similarly, the statistical analysis conducted on geographies consisting of 55,728,704 people shows a weak negative correlation between the proportion of Bermudans and per capita income in the United States with a correlation coefficient (R) of -0.226 and weighted average of $42,911, a difference of 12.6%.
Per Capita Income Correlation Summary
| Measurement | Hmong | Bermudan |
| Minimum | $3,563 | $4,995 |
| Maximum | $84,315 | $96,710 |
| Range | $80,752 | $91,715 |
| Mean | $38,244 | $41,714 |
| Median | $39,777 | $40,756 |
| Interquartile 25% (IQ1) | $30,464 | $33,973 |
| Interquartile 75% (IQ3) | $43,732 | $45,741 |
| Interquartile Range (IQR) | $13,268 | $11,767 |
| Standard Deviation (Sample) | $12,703 | $16,477 |
| Standard Deviation (Population) | $12,539 | $16,314 |
Similar Demographics by Per Capita Income
Demographics Similar to Hmong by Per Capita Income
In terms of per capita income, the demographic groups most similar to Hmong are Comanche ($38,088, a difference of 0.080%), Immigrants from Liberia ($38,165, a difference of 0.12%), Immigrants from Nicaragua ($38,065, a difference of 0.15%), Colville ($38,047, a difference of 0.19%), and Potawatomi ($38,046, a difference of 0.20%).
| Demographics | Rating | Rank | Per Capita Income |
| Immigrants | Jamaica | 0.4 /100 | #269 | Tragic $38,766 |
| Immigrants | Belize | 0.3 /100 | #270 | Tragic $38,614 |
| Central Americans | 0.3 /100 | #271 | Tragic $38,560 |
| Immigrants | Cabo Verde | 0.3 /100 | #272 | Tragic $38,540 |
| Nepalese | 0.3 /100 | #273 | Tragic $38,442 |
| Immigrants | El Salvador | 0.3 /100 | #274 | Tragic $38,394 |
| Immigrants | Liberia | 0.2 /100 | #275 | Tragic $38,165 |
| Hmong | 0.2 /100 | #276 | Tragic $38,120 |
| Comanche | 0.2 /100 | #277 | Tragic $38,088 |
| Immigrants | Nicaragua | 0.2 /100 | #278 | Tragic $38,065 |
| Colville | 0.2 /100 | #279 | Tragic $38,047 |
| Potawatomi | 0.2 /100 | #280 | Tragic $38,046 |
| Immigrants | Dominica | 0.2 /100 | #281 | Tragic $37,952 |
| Immigrants | Laos | 0.1 /100 | #282 | Tragic $37,857 |
| Pennsylvania Germans | 0.1 /100 | #283 | Tragic $37,842 |
Demographics Similar to Bermudans by Per Capita Income
In terms of per capita income, the demographic groups most similar to Bermudans are Immigrants from Africa ($42,950, a difference of 0.090%), Immigrants from Colombia ($42,971, a difference of 0.14%), French Canadian ($43,003, a difference of 0.21%), Immigrants ($43,010, a difference of 0.23%), and Kenyan ($42,808, a difference of 0.24%).
| Demographics | Rating | Rank | Per Capita Income |
| Immigrants | Vietnam | 38.1 /100 | #182 | Fair $43,229 |
| Germans | 33.9 /100 | #183 | Fair $43,067 |
| Spaniards | 32.9 /100 | #184 | Fair $43,028 |
| Immigrants | Immigrants | 32.5 /100 | #185 | Fair $43,010 |
| French Canadians | 32.3 /100 | #186 | Fair $43,003 |
| Immigrants | Colombia | 31.5 /100 | #187 | Fair $42,971 |
| Immigrants | Africa | 31.0 /100 | #188 | Fair $42,950 |
| Bermudans | 30.1 /100 | #189 | Fair $42,911 |
| Kenyans | 27.7 /100 | #190 | Fair $42,808 |
| Yugoslavians | 27.4 /100 | #191 | Fair $42,792 |
| Iraqis | 26.7 /100 | #192 | Fair $42,760 |
| Immigrants | Sierra Leone | 26.5 /100 | #193 | Fair $42,752 |
| Immigrants | Fiji | 25.2 /100 | #194 | Fair $42,694 |
| Immigrants | Kenya | 24.5 /100 | #195 | Fair $42,661 |
| Dutch | 23.4 /100 | #196 | Fair $42,605 |