Black/African American vs Barbadian Per Capita Income
COMPARE
Black/African American
Barbadian
Per Capita Income
Per Capita Income Comparison
Blacks/African Americans
Barbadians
$35,564
PER CAPITA INCOME
0.0/ 100
METRIC RATING
321st/ 347
METRIC RANK
$42,406
PER CAPITA INCOME
19.6/ 100
METRIC RATING
199th/ 347
METRIC RANK
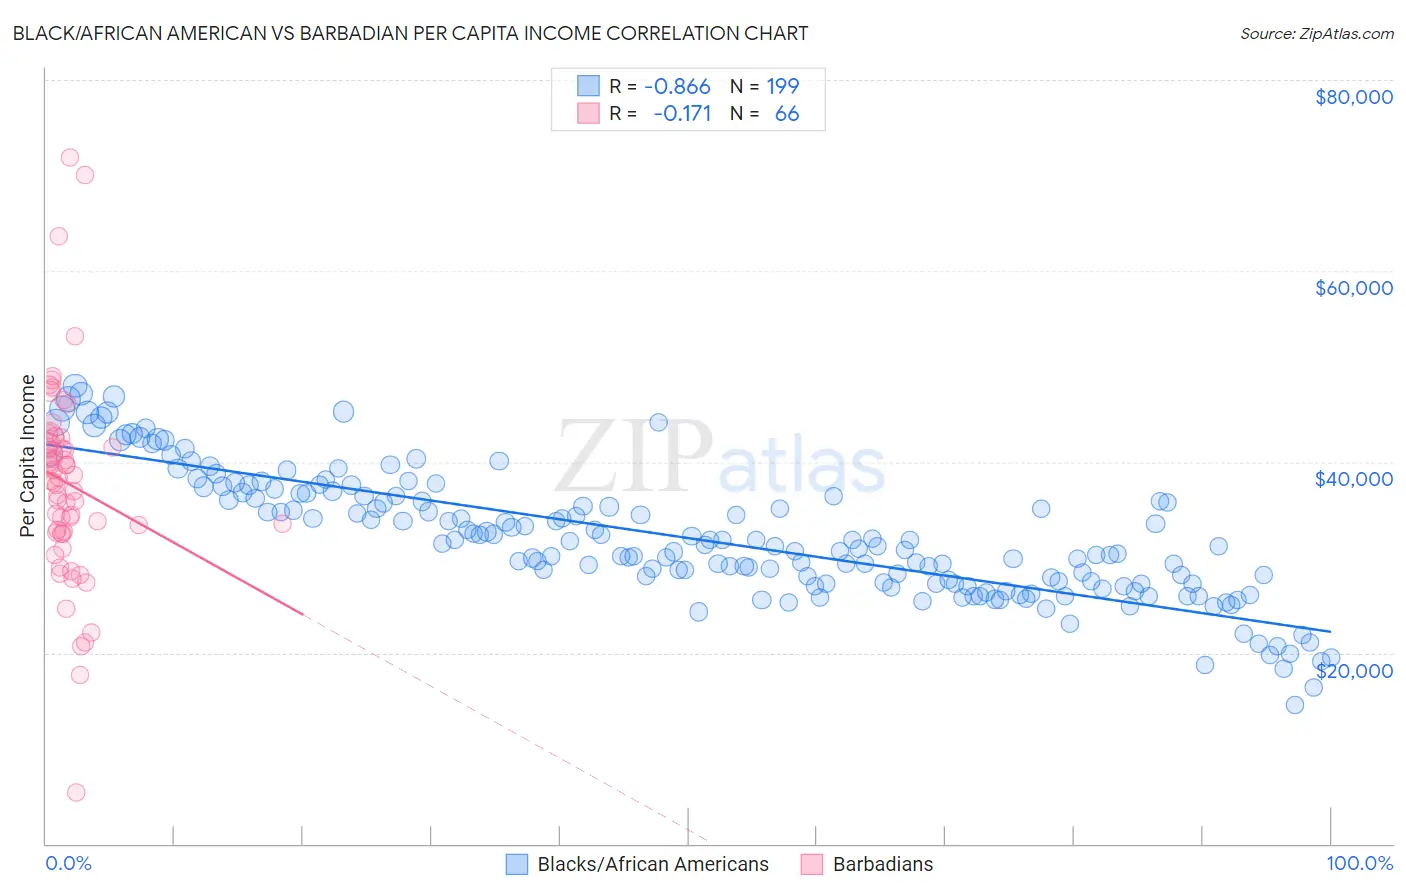
Black/African American vs Barbadian Per Capita Income Correlation Chart
The statistical analysis conducted on geographies consisting of 564,923,865 people shows a very strong negative correlation between the proportion of Blacks/African Americans and per capita income in the United States with a correlation coefficient (R) of -0.866 and weighted average of $35,564. Similarly, the statistical analysis conducted on geographies consisting of 141,304,082 people shows a poor negative correlation between the proportion of Barbadians and per capita income in the United States with a correlation coefficient (R) of -0.171 and weighted average of $42,406, a difference of 19.2%.
Per Capita Income Correlation Summary
| Measurement | Black/African American | Barbadian |
| Minimum | $14,598 | $5,324 |
| Maximum | $47,964 | $71,926 |
| Range | $33,366 | $66,602 |
| Mean | $32,008 | $37,719 |
| Median | $31,154 | $37,906 |
| Interquartile 25% (IQ1) | $27,216 | $32,556 |
| Interquartile 75% (IQ3) | $36,450 | $41,973 |
| Interquartile Range (IQR) | $9,234 | $9,418 |
| Standard Deviation (Sample) | $6,581 | $10,673 |
| Standard Deviation (Population) | $6,564 | $10,592 |
Similar Demographics by Per Capita Income
Demographics Similar to Blacks/African Americans by Per Capita Income
In terms of per capita income, the demographic groups most similar to Blacks/African Americans are Creek ($35,546, a difference of 0.050%), Hispanic or Latino ($35,688, a difference of 0.35%), Immigrants from Congo ($35,720, a difference of 0.44%), Cheyenne ($35,276, a difference of 0.82%), and Bangladeshi ($35,897, a difference of 0.94%).
| Demographics | Rating | Rank | Per Capita Income |
| Seminole | 0.0 /100 | #314 | Tragic $36,180 |
| Yaqui | 0.0 /100 | #315 | Tragic $36,112 |
| Choctaw | 0.0 /100 | #316 | Tragic $35,999 |
| Dutch West Indians | 0.0 /100 | #317 | Tragic $35,922 |
| Bangladeshis | 0.0 /100 | #318 | Tragic $35,897 |
| Immigrants | Congo | 0.0 /100 | #319 | Tragic $35,720 |
| Hispanics or Latinos | 0.0 /100 | #320 | Tragic $35,688 |
| Blacks/African Americans | 0.0 /100 | #321 | Tragic $35,564 |
| Creek | 0.0 /100 | #322 | Tragic $35,546 |
| Cheyenne | 0.0 /100 | #323 | Tragic $35,276 |
| Kiowa | 0.0 /100 | #324 | Tragic $35,102 |
| Immigrants | Central America | 0.0 /100 | #325 | Tragic $34,974 |
| Immigrants | Cuba | 0.0 /100 | #326 | Tragic $34,910 |
| Apache | 0.0 /100 | #327 | Tragic $34,886 |
| Menominee | 0.0 /100 | #328 | Tragic $34,578 |
Demographics Similar to Barbadians by Per Capita Income
In terms of per capita income, the demographic groups most similar to Barbadians are Immigrants from Portugal ($42,412, a difference of 0.010%), Vietnamese ($42,368, a difference of 0.090%), Immigrants from Thailand ($42,289, a difference of 0.28%), Immigrants from Bosnia and Herzegovina ($42,278, a difference of 0.30%), and Scotch-Irish ($42,563, a difference of 0.37%).
| Demographics | Rating | Rank | Per Capita Income |
| Iraqis | 26.7 /100 | #192 | Fair $42,760 |
| Immigrants | Sierra Leone | 26.5 /100 | #193 | Fair $42,752 |
| Immigrants | Fiji | 25.2 /100 | #194 | Fair $42,694 |
| Immigrants | Kenya | 24.5 /100 | #195 | Fair $42,661 |
| Dutch | 23.4 /100 | #196 | Fair $42,605 |
| Scotch-Irish | 22.6 /100 | #197 | Fair $42,563 |
| Immigrants | Portugal | 19.7 /100 | #198 | Poor $42,412 |
| Barbadians | 19.6 /100 | #199 | Poor $42,406 |
| Vietnamese | 19.0 /100 | #200 | Poor $42,368 |
| Immigrants | Thailand | 17.6 /100 | #201 | Poor $42,289 |
| Immigrants | Bosnia and Herzegovina | 17.5 /100 | #202 | Poor $42,278 |
| Spanish | 17.0 /100 | #203 | Poor $42,249 |
| Aleuts | 16.4 /100 | #204 | Poor $42,210 |
| Whites/Caucasians | 15.9 /100 | #205 | Poor $42,180 |
| Ghanaians | 15.7 /100 | #206 | Poor $42,164 |