German Russian vs Barbadian Per Capita Income
COMPARE
German Russian
Barbadian
Per Capita Income
Per Capita Income Comparison
German Russians
Barbadians
$40,266
PER CAPITA INCOME
2.2/ 100
METRIC RATING
243rd/ 347
METRIC RANK
$42,406
PER CAPITA INCOME
19.6/ 100
METRIC RATING
199th/ 347
METRIC RANK
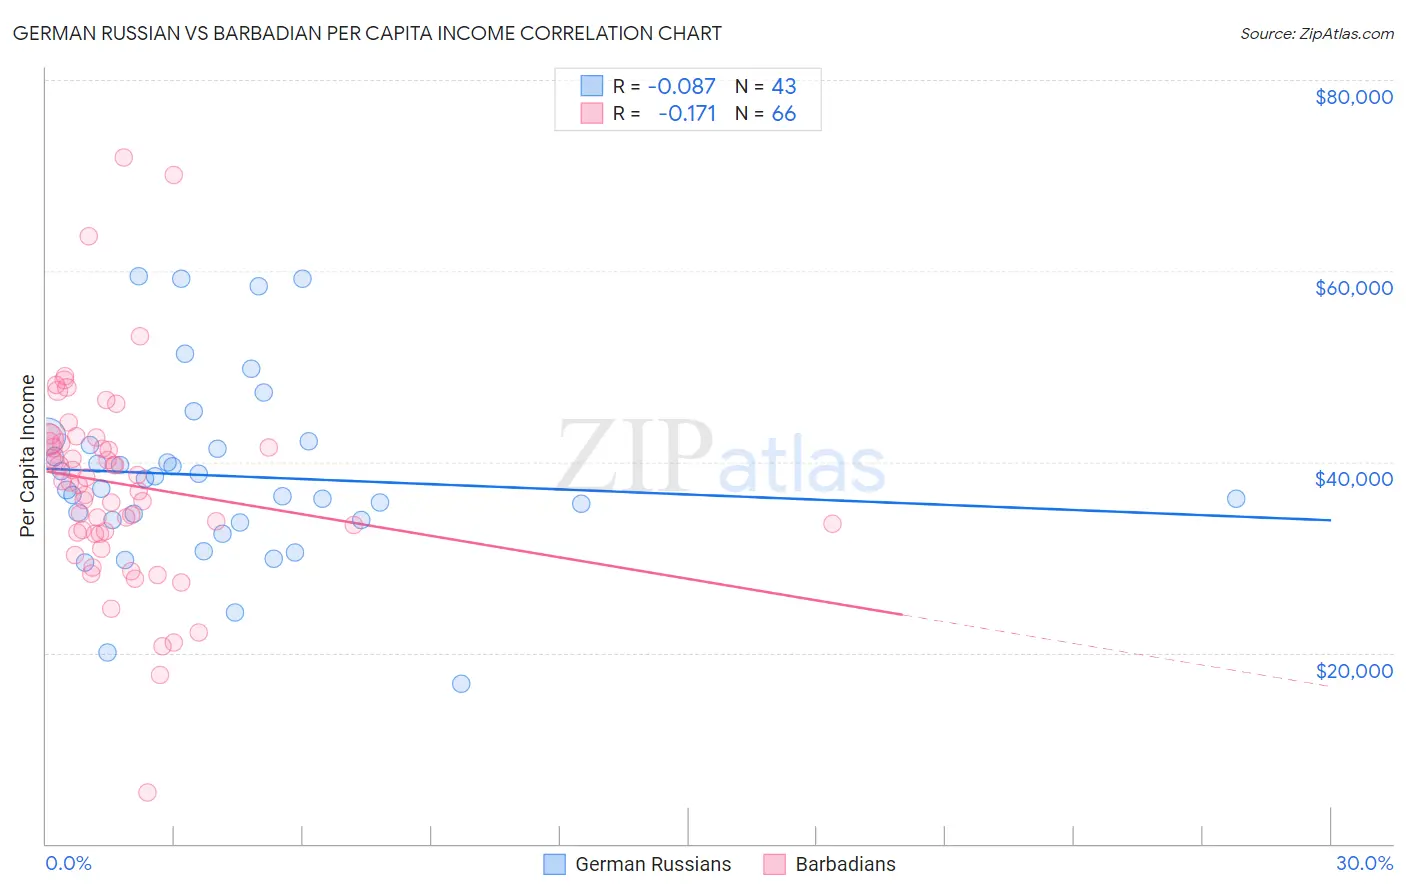
German Russian vs Barbadian Per Capita Income Correlation Chart
The statistical analysis conducted on geographies consisting of 96,461,984 people shows a slight negative correlation between the proportion of German Russians and per capita income in the United States with a correlation coefficient (R) of -0.087 and weighted average of $40,266. Similarly, the statistical analysis conducted on geographies consisting of 141,304,082 people shows a poor negative correlation between the proportion of Barbadians and per capita income in the United States with a correlation coefficient (R) of -0.171 and weighted average of $42,406, a difference of 5.3%.
Per Capita Income Correlation Summary
| Measurement | German Russian | Barbadian |
| Minimum | $16,776 | $5,324 |
| Maximum | $59,479 | $71,926 |
| Range | $42,703 | $66,602 |
| Mean | $38,536 | $37,719 |
| Median | $37,221 | $37,906 |
| Interquartile 25% (IQ1) | $33,912 | $32,556 |
| Interquartile 75% (IQ3) | $41,773 | $41,973 |
| Interquartile Range (IQR) | $7,861 | $9,418 |
| Standard Deviation (Sample) | $9,403 | $10,673 |
| Standard Deviation (Population) | $9,293 | $10,592 |
Similar Demographics by Per Capita Income
Demographics Similar to German Russians by Per Capita Income
In terms of per capita income, the demographic groups most similar to German Russians are French American Indian ($40,244, a difference of 0.060%), Immigrants from Western Africa ($40,294, a difference of 0.070%), British West Indian ($40,330, a difference of 0.16%), Immigrants from Nigeria ($40,339, a difference of 0.18%), and Tsimshian ($40,344, a difference of 0.19%).
| Demographics | Rating | Rank | Per Capita Income |
| Immigrants | Nonimmigrants | 3.4 /100 | #236 | Tragic $40,669 |
| Immigrants | Cambodia | 2.6 /100 | #237 | Tragic $40,434 |
| Somalis | 2.4 /100 | #238 | Tragic $40,367 |
| Tsimshian | 2.4 /100 | #239 | Tragic $40,344 |
| Immigrants | Nigeria | 2.3 /100 | #240 | Tragic $40,339 |
| British West Indians | 2.3 /100 | #241 | Tragic $40,330 |
| Immigrants | Western Africa | 2.2 /100 | #242 | Tragic $40,294 |
| German Russians | 2.2 /100 | #243 | Tragic $40,266 |
| French American Indians | 2.1 /100 | #244 | Tragic $40,244 |
| Sub-Saharan Africans | 1.9 /100 | #245 | Tragic $40,152 |
| Cree | 1.7 /100 | #246 | Tragic $40,056 |
| Immigrants | Somalia | 1.6 /100 | #247 | Tragic $39,974 |
| Cape Verdeans | 1.5 /100 | #248 | Tragic $39,935 |
| Japanese | 1.4 /100 | #249 | Tragic $39,870 |
| Immigrants | Burma/Myanmar | 1.3 /100 | #250 | Tragic $39,827 |
Demographics Similar to Barbadians by Per Capita Income
In terms of per capita income, the demographic groups most similar to Barbadians are Immigrants from Portugal ($42,412, a difference of 0.010%), Vietnamese ($42,368, a difference of 0.090%), Immigrants from Thailand ($42,289, a difference of 0.28%), Immigrants from Bosnia and Herzegovina ($42,278, a difference of 0.30%), and Scotch-Irish ($42,563, a difference of 0.37%).
| Demographics | Rating | Rank | Per Capita Income |
| Iraqis | 26.7 /100 | #192 | Fair $42,760 |
| Immigrants | Sierra Leone | 26.5 /100 | #193 | Fair $42,752 |
| Immigrants | Fiji | 25.2 /100 | #194 | Fair $42,694 |
| Immigrants | Kenya | 24.5 /100 | #195 | Fair $42,661 |
| Dutch | 23.4 /100 | #196 | Fair $42,605 |
| Scotch-Irish | 22.6 /100 | #197 | Fair $42,563 |
| Immigrants | Portugal | 19.7 /100 | #198 | Poor $42,412 |
| Barbadians | 19.6 /100 | #199 | Poor $42,406 |
| Vietnamese | 19.0 /100 | #200 | Poor $42,368 |
| Immigrants | Thailand | 17.6 /100 | #201 | Poor $42,289 |
| Immigrants | Bosnia and Herzegovina | 17.5 /100 | #202 | Poor $42,278 |
| Spanish | 17.0 /100 | #203 | Poor $42,249 |
| Aleuts | 16.4 /100 | #204 | Poor $42,210 |
| Whites/Caucasians | 15.9 /100 | #205 | Poor $42,180 |
| Ghanaians | 15.7 /100 | #206 | Poor $42,164 |