Immigrants from Italy vs Carpatho Rusyn Median Household Income
COMPARE
Immigrants from Italy
Carpatho Rusyn
Median Household Income
Median Household Income Comparison
Immigrants from Italy
Carpatho Rusyns
$93,465
MEDIAN HOUSEHOLD INCOME
99.5/ 100
METRIC RATING
75th/ 347
METRIC RANK
$86,635
MEDIAN HOUSEHOLD INCOME
72.8/ 100
METRIC RATING
155th/ 347
METRIC RANK
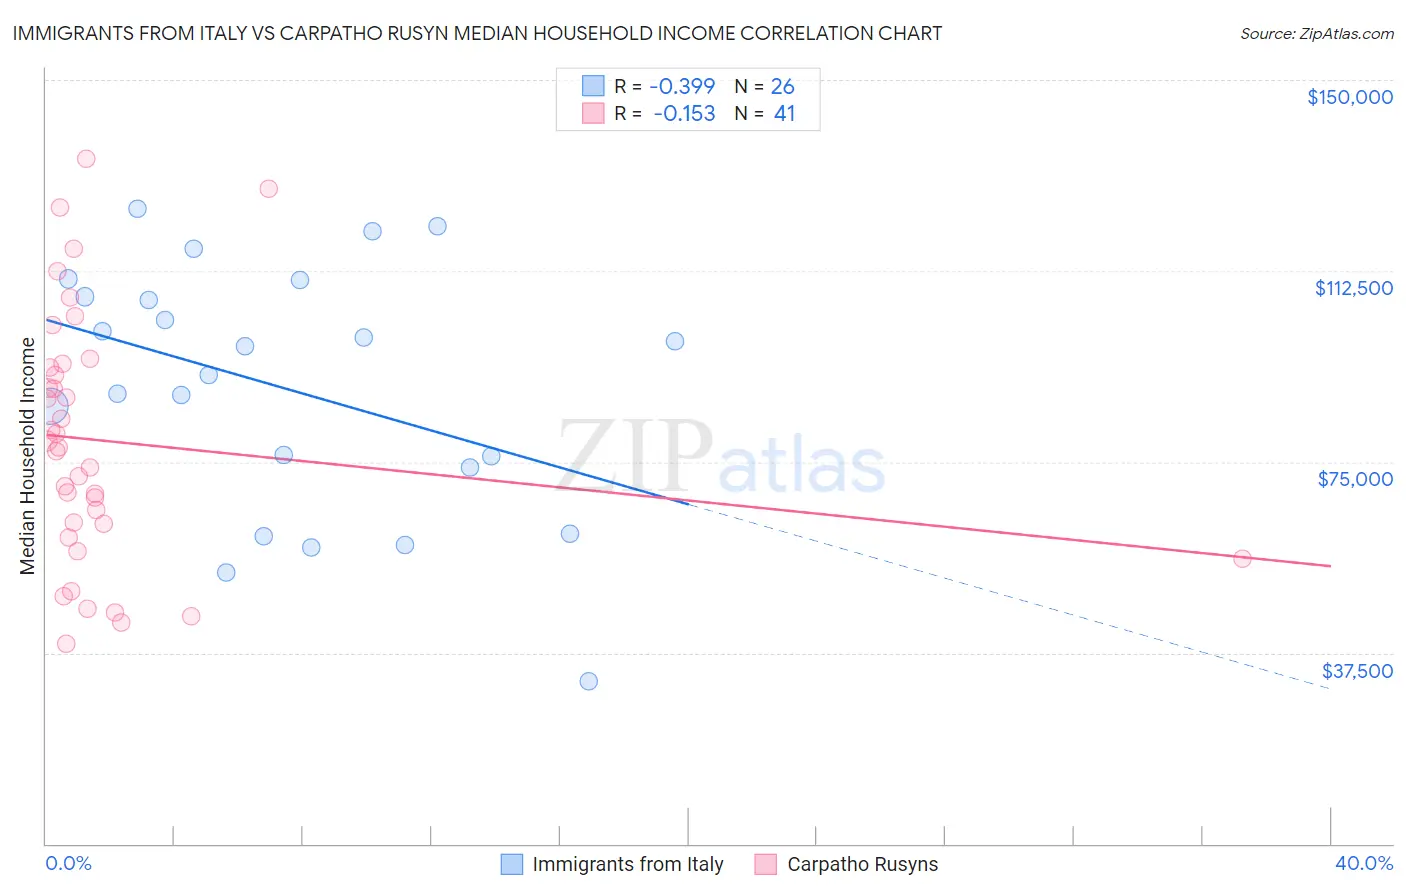
Immigrants from Italy vs Carpatho Rusyn Median Household Income Correlation Chart
The statistical analysis conducted on geographies consisting of 324,128,900 people shows a mild negative correlation between the proportion of Immigrants from Italy and median household income in the United States with a correlation coefficient (R) of -0.399 and weighted average of $93,465. Similarly, the statistical analysis conducted on geographies consisting of 58,866,106 people shows a poor negative correlation between the proportion of Carpatho Rusyns and median household income in the United States with a correlation coefficient (R) of -0.153 and weighted average of $86,635, a difference of 7.9%.
Median Household Income Correlation Summary
| Measurement | Immigrants from Italy | Carpatho Rusyn |
| Minimum | $31,923 | $39,318 |
| Maximum | $124,607 | $134,440 |
| Range | $92,684 | $95,122 |
| Mean | $89,307 | $79,082 |
| Median | $94,900 | $77,705 |
| Interquartile 25% (IQ1) | $73,911 | $61,521 |
| Interquartile 75% (IQ3) | $107,408 | $93,841 |
| Interquartile Range (IQR) | $33,497 | $32,321 |
| Standard Deviation (Sample) | $24,372 | $24,465 |
| Standard Deviation (Population) | $23,899 | $24,165 |
Similar Demographics by Median Household Income
Demographics Similar to Immigrants from Italy by Median Household Income
In terms of median household income, the demographic groups most similar to Immigrants from Italy are South African ($93,379, a difference of 0.090%), Immigrants from Afghanistan ($93,375, a difference of 0.10%), Immigrants from Latvia ($93,602, a difference of 0.15%), Immigrants from Egypt ($93,700, a difference of 0.25%), and Immigrants from Bulgaria ($93,148, a difference of 0.34%).
| Demographics | Rating | Rank | Median Household Income |
| Mongolians | 99.7 /100 | #68 | Exceptional $93,971 |
| Argentineans | 99.7 /100 | #69 | Exceptional $93,960 |
| Immigrants | Fiji | 99.7 /100 | #70 | Exceptional $93,933 |
| Immigrants | Philippines | 99.6 /100 | #71 | Exceptional $93,899 |
| Lithuanians | 99.6 /100 | #72 | Exceptional $93,852 |
| Immigrants | Egypt | 99.6 /100 | #73 | Exceptional $93,700 |
| Immigrants | Latvia | 99.6 /100 | #74 | Exceptional $93,602 |
| Immigrants | Italy | 99.5 /100 | #75 | Exceptional $93,465 |
| South Africans | 99.5 /100 | #76 | Exceptional $93,379 |
| Immigrants | Afghanistan | 99.5 /100 | #77 | Exceptional $93,375 |
| Immigrants | Bulgaria | 99.4 /100 | #78 | Exceptional $93,148 |
| Sri Lankans | 99.4 /100 | #79 | Exceptional $93,093 |
| Tongans | 99.4 /100 | #80 | Exceptional $93,076 |
| Immigrants | Eastern Europe | 99.4 /100 | #81 | Exceptional $93,051 |
| Immigrants | Spain | 99.3 /100 | #82 | Exceptional $92,732 |
Demographics Similar to Carpatho Rusyns by Median Household Income
In terms of median household income, the demographic groups most similar to Carpatho Rusyns are Immigrants from Albania ($86,534, a difference of 0.12%), Immigrants from Germany ($86,764, a difference of 0.15%), Samoan ($86,498, a difference of 0.16%), Moroccan ($86,468, a difference of 0.19%), and South American ($86,824, a difference of 0.22%).
| Demographics | Rating | Rank | Median Household Income |
| Costa Ricans | 80.0 /100 | #148 | Excellent $87,262 |
| Immigrants | Nepal | 77.7 /100 | #149 | Good $87,046 |
| Basques | 77.2 /100 | #150 | Good $87,001 |
| Hungarians | 76.3 /100 | #151 | Good $86,920 |
| Immigrants | Saudi Arabia | 75.8 /100 | #152 | Good $86,875 |
| South Americans | 75.1 /100 | #153 | Good $86,824 |
| Immigrants | Germany | 74.4 /100 | #154 | Good $86,764 |
| Carpatho Rusyns | 72.8 /100 | #155 | Good $86,635 |
| Immigrants | Albania | 71.5 /100 | #156 | Good $86,534 |
| Samoans | 71.0 /100 | #157 | Good $86,498 |
| Moroccans | 70.6 /100 | #158 | Good $86,468 |
| Immigrants | Uzbekistan | 70.1 /100 | #159 | Good $86,425 |
| Luxembourgers | 70.0 /100 | #160 | Good $86,418 |
| Slavs | 69.7 /100 | #161 | Good $86,398 |
| Guamanians/Chamorros | 67.7 /100 | #162 | Good $86,255 |