Hopi vs Carpatho Rusyn Median Household Income
COMPARE
Hopi
Carpatho Rusyn
Median Household Income
Median Household Income Comparison
Hopi
Carpatho Rusyns
$65,043
MEDIAN HOUSEHOLD INCOME
0.0/ 100
METRIC RATING
339th/ 347
METRIC RANK
$86,635
MEDIAN HOUSEHOLD INCOME
72.8/ 100
METRIC RATING
155th/ 347
METRIC RANK
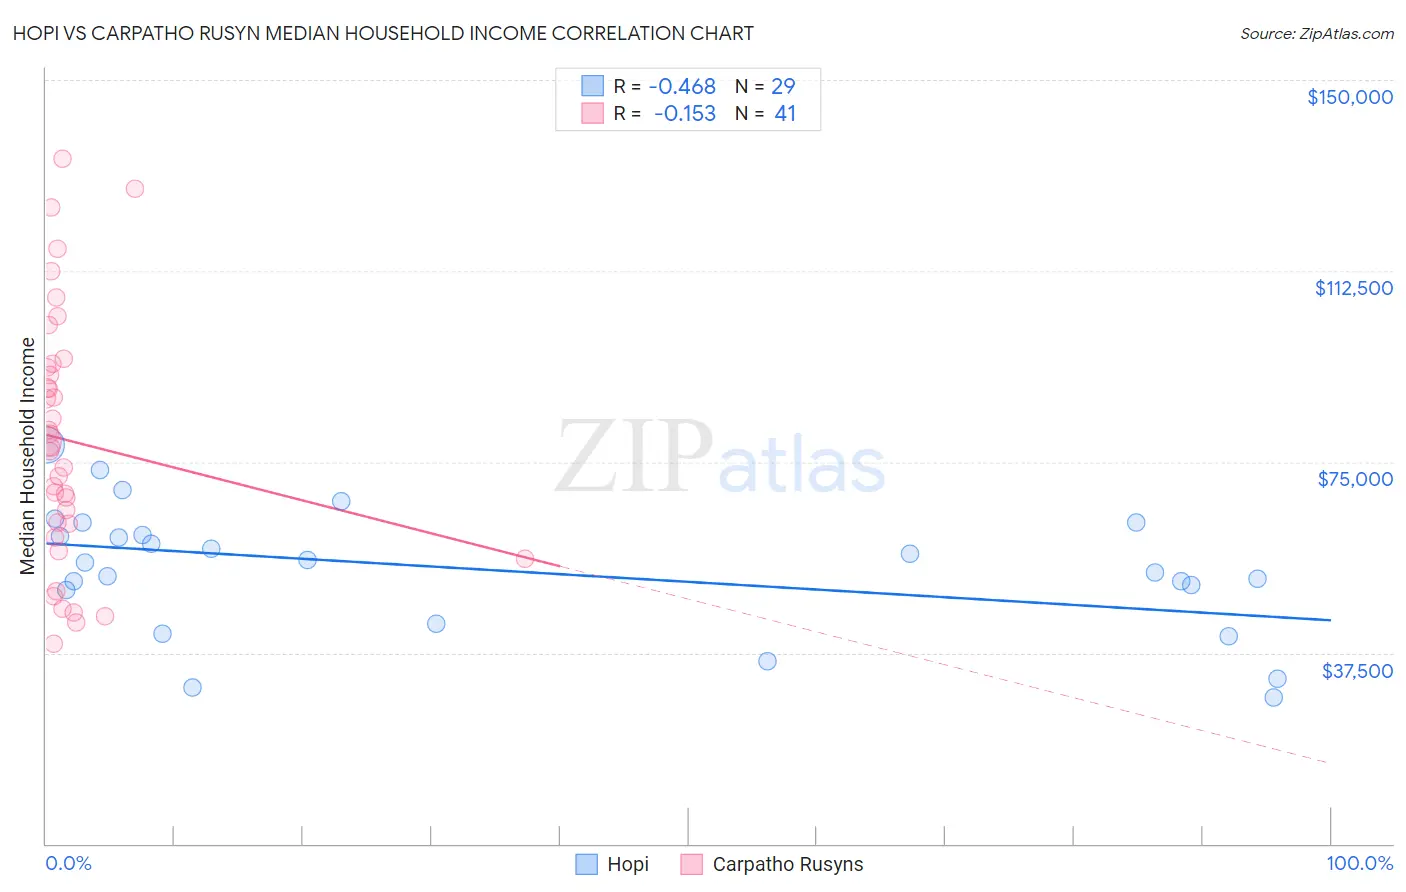
Hopi vs Carpatho Rusyn Median Household Income Correlation Chart
The statistical analysis conducted on geographies consisting of 74,731,446 people shows a moderate negative correlation between the proportion of Hopi and median household income in the United States with a correlation coefficient (R) of -0.468 and weighted average of $65,043. Similarly, the statistical analysis conducted on geographies consisting of 58,866,106 people shows a poor negative correlation between the proportion of Carpatho Rusyns and median household income in the United States with a correlation coefficient (R) of -0.153 and weighted average of $86,635, a difference of 33.2%.
Median Household Income Correlation Summary
| Measurement | Hopi | Carpatho Rusyn |
| Minimum | $28,831 | $39,318 |
| Maximum | $78,310 | $134,440 |
| Range | $49,479 | $95,122 |
| Mean | $53,752 | $79,082 |
| Median | $55,122 | $77,705 |
| Interquartile 25% (IQ1) | $46,511 | $61,521 |
| Interquartile 75% (IQ3) | $61,881 | $93,841 |
| Interquartile Range (IQR) | $15,370 | $32,321 |
| Standard Deviation (Sample) | $12,388 | $24,465 |
| Standard Deviation (Population) | $12,173 | $24,165 |
Similar Demographics by Median Household Income
Demographics Similar to Hopi by Median Household Income
In terms of median household income, the demographic groups most similar to Hopi are Immigrants from Yemen ($65,194, a difference of 0.23%), Pueblo ($64,692, a difference of 0.54%), Kiowa ($65,914, a difference of 1.3%), Crow ($63,681, a difference of 2.1%), and Immigrants from Congo ($66,768, a difference of 2.6%).
| Demographics | Rating | Rank | Median Household Income |
| Sioux | 0.0 /100 | #332 | Tragic $67,792 |
| Creek | 0.0 /100 | #333 | Tragic $67,715 |
| Blacks/African Americans | 0.0 /100 | #334 | Tragic $67,573 |
| Cheyenne | 0.0 /100 | #335 | Tragic $66,974 |
| Immigrants | Congo | 0.0 /100 | #336 | Tragic $66,768 |
| Kiowa | 0.0 /100 | #337 | Tragic $65,914 |
| Immigrants | Yemen | 0.0 /100 | #338 | Tragic $65,194 |
| Hopi | 0.0 /100 | #339 | Tragic $65,043 |
| Pueblo | 0.0 /100 | #340 | Tragic $64,692 |
| Crow | 0.0 /100 | #341 | Tragic $63,681 |
| Pima | 0.0 /100 | #342 | Tragic $63,262 |
| Houma | 0.0 /100 | #343 | Tragic $62,575 |
| Tohono O'odham | 0.0 /100 | #344 | Tragic $61,663 |
| Puerto Ricans | 0.0 /100 | #345 | Tragic $59,197 |
| Navajo | 0.0 /100 | #346 | Tragic $59,159 |
Demographics Similar to Carpatho Rusyns by Median Household Income
In terms of median household income, the demographic groups most similar to Carpatho Rusyns are Immigrants from Albania ($86,534, a difference of 0.12%), Immigrants from Germany ($86,764, a difference of 0.15%), Samoan ($86,498, a difference of 0.16%), Moroccan ($86,468, a difference of 0.19%), and South American ($86,824, a difference of 0.22%).
| Demographics | Rating | Rank | Median Household Income |
| Costa Ricans | 80.0 /100 | #148 | Excellent $87,262 |
| Immigrants | Nepal | 77.7 /100 | #149 | Good $87,046 |
| Basques | 77.2 /100 | #150 | Good $87,001 |
| Hungarians | 76.3 /100 | #151 | Good $86,920 |
| Immigrants | Saudi Arabia | 75.8 /100 | #152 | Good $86,875 |
| South Americans | 75.1 /100 | #153 | Good $86,824 |
| Immigrants | Germany | 74.4 /100 | #154 | Good $86,764 |
| Carpatho Rusyns | 72.8 /100 | #155 | Good $86,635 |
| Immigrants | Albania | 71.5 /100 | #156 | Good $86,534 |
| Samoans | 71.0 /100 | #157 | Good $86,498 |
| Moroccans | 70.6 /100 | #158 | Good $86,468 |
| Immigrants | Uzbekistan | 70.1 /100 | #159 | Good $86,425 |
| Luxembourgers | 70.0 /100 | #160 | Good $86,418 |
| Slavs | 69.7 /100 | #161 | Good $86,398 |
| Guamanians/Chamorros | 67.7 /100 | #162 | Good $86,255 |