Cypriot vs Immigrants from West Indies Wage/Income Gap
COMPARE
Cypriot
Immigrants from West Indies
Wage/Income Gap
Wage/Income Gap Comparison
Cypriots
Immigrants from West Indies
27.3%
WAGE/INCOME GAP
2.8/ 100
METRIC RATING
248th/ 347
METRIC RANK
19.2%
WAGE/INCOME GAP
100.0/ 100
METRIC RATING
12th/ 347
METRIC RANK
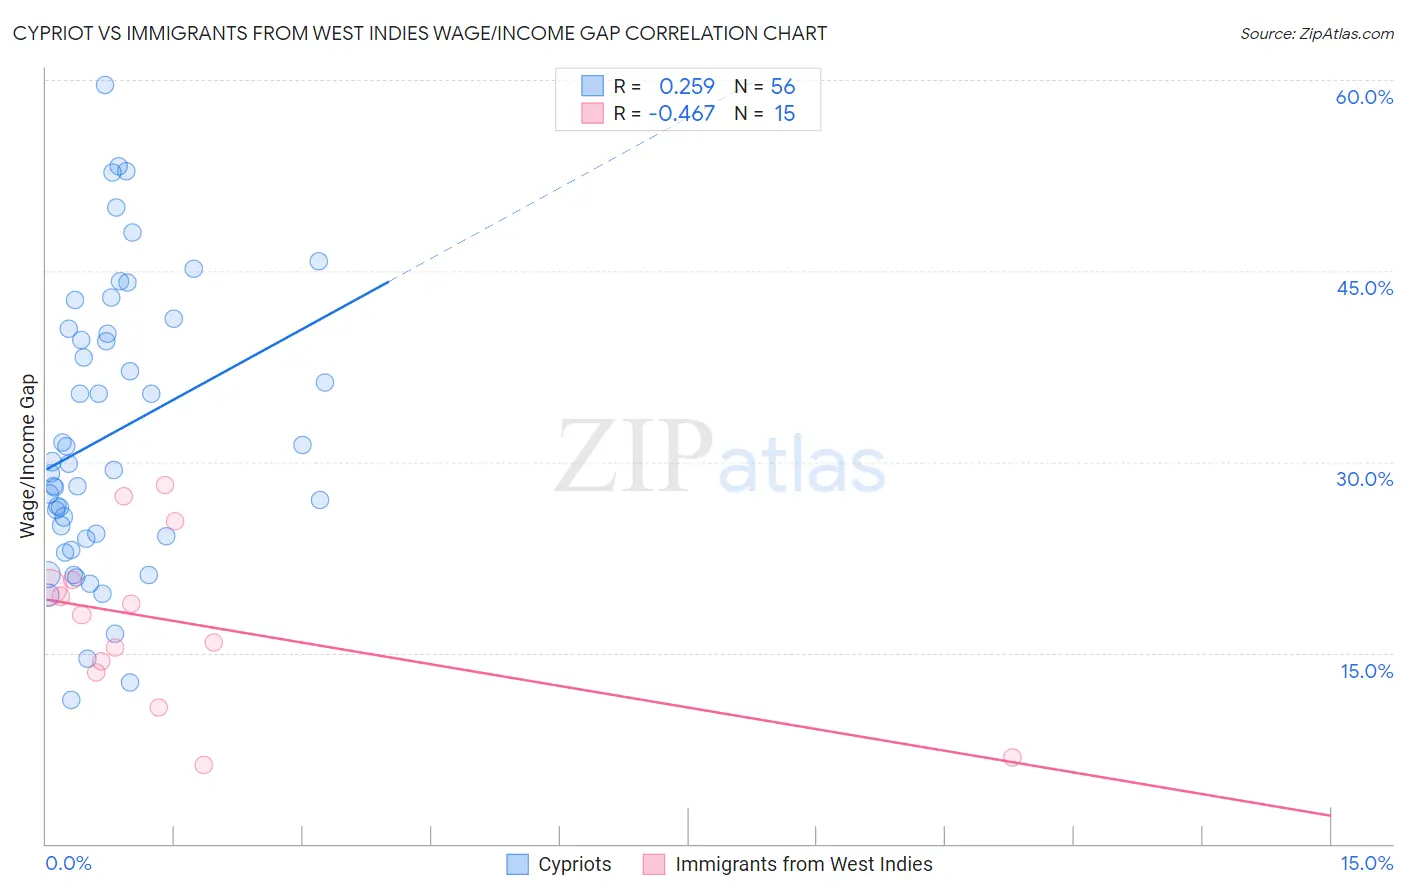
Cypriot vs Immigrants from West Indies Wage/Income Gap Correlation Chart
The statistical analysis conducted on geographies consisting of 61,856,994 people shows a weak positive correlation between the proportion of Cypriots and wage/income gap percentage in the United States with a correlation coefficient (R) of 0.259 and weighted average of 27.3%. Similarly, the statistical analysis conducted on geographies consisting of 72,447,771 people shows a moderate negative correlation between the proportion of Immigrants from West Indies and wage/income gap percentage in the United States with a correlation coefficient (R) of -0.467 and weighted average of 19.2%, a difference of 41.8%.
Wage/Income Gap Correlation Summary
| Measurement | Cypriot | Immigrants from West Indies |
| Minimum | 11.3% | 6.2% |
| Maximum | 59.6% | 28.2% |
| Range | 48.3% | 21.9% |
| Mean | 32.1% | 17.4% |
| Median | 29.6% | 18.0% |
| Interquartile 25% (IQ1) | 24.1% | 13.4% |
| Interquartile 75% (IQ3) | 40.2% | 20.7% |
| Interquartile Range (IQR) | 16.2% | 7.3% |
| Standard Deviation (Sample) | 11.2% | 6.6% |
| Standard Deviation (Population) | 11.1% | 6.4% |
Similar Demographics by Wage/Income Gap
Demographics Similar to Cypriots by Wage/Income Gap
In terms of wage/income gap, the demographic groups most similar to Cypriots are Carpatho Rusyn (27.3%, a difference of 0.0%), Celtic (27.3%, a difference of 0.010%), Immigrants from Czechoslovakia (27.3%, a difference of 0.020%), Immigrants from Norway (27.3%, a difference of 0.13%), and Ukrainian (27.3%, a difference of 0.19%).
| Demographics | Rating | Rank | Wage/Income Gap |
| Creek | 3.8 /100 | #241 | Tragic 27.1% |
| Immigrants | Sri Lanka | 3.7 /100 | #242 | Tragic 27.1% |
| Spanish | 3.6 /100 | #243 | Tragic 27.1% |
| Chickasaw | 3.5 /100 | #244 | Tragic 27.2% |
| Immigrants | Azores | 3.5 /100 | #245 | Tragic 27.2% |
| Immigrants | Nonimmigrants | 3.3 /100 | #246 | Tragic 27.2% |
| Celtics | 2.8 /100 | #247 | Tragic 27.3% |
| Cypriots | 2.8 /100 | #248 | Tragic 27.3% |
| Carpatho Rusyns | 2.7 /100 | #249 | Tragic 27.3% |
| Immigrants | Czechoslovakia | 2.7 /100 | #250 | Tragic 27.3% |
| Immigrants | Norway | 2.5 /100 | #251 | Tragic 27.3% |
| Ukrainians | 2.4 /100 | #252 | Tragic 27.3% |
| Portuguese | 2.2 /100 | #253 | Tragic 27.4% |
| Israelis | 2.1 /100 | #254 | Tragic 27.4% |
| Immigrants | France | 2.1 /100 | #255 | Tragic 27.4% |
Demographics Similar to Immigrants from West Indies by Wage/Income Gap
In terms of wage/income gap, the demographic groups most similar to Immigrants from West Indies are Immigrants from Haiti (19.2%, a difference of 0.11%), Trinidadian and Tobagonian (19.3%, a difference of 0.48%), Immigrants from Trinidad and Tobago (19.3%, a difference of 0.53%), Crow (19.1%, a difference of 0.90%), and Barbadian (19.0%, a difference of 1.4%).
| Demographics | Rating | Rank | Wage/Income Gap |
| Guyanese | 100.0 /100 | #5 | Exceptional 18.3% |
| Immigrants | Guyana | 100.0 /100 | #6 | Exceptional 18.4% |
| Puerto Ricans | 100.0 /100 | #7 | Exceptional 18.7% |
| Immigrants | Jamaica | 100.0 /100 | #8 | Exceptional 18.8% |
| Barbadians | 100.0 /100 | #9 | Exceptional 19.0% |
| Crow | 100.0 /100 | #10 | Exceptional 19.1% |
| Immigrants | Haiti | 100.0 /100 | #11 | Exceptional 19.2% |
| Immigrants | West Indies | 100.0 /100 | #12 | Exceptional 19.2% |
| Trinidadians and Tobagonians | 100.0 /100 | #13 | Exceptional 19.3% |
| Immigrants | Trinidad and Tobago | 100.0 /100 | #14 | Exceptional 19.3% |
| West Indians | 100.0 /100 | #15 | Exceptional 19.6% |
| Jamaicans | 100.0 /100 | #16 | Exceptional 19.6% |
| Haitians | 100.0 /100 | #17 | Exceptional 19.7% |
| Hopi | 100.0 /100 | #18 | Exceptional 20.0% |
| Immigrants | Dominica | 100.0 /100 | #19 | Exceptional 20.0% |