Cypriot vs Immigrants from Zimbabwe Wage/Income Gap
COMPARE
Cypriot
Immigrants from Zimbabwe
Wage/Income Gap
Wage/Income Gap Comparison
Cypriots
Immigrants from Zimbabwe
27.3%
WAGE/INCOME GAP
2.8/ 100
METRIC RATING
248th/ 347
METRIC RANK
25.3%
WAGE/INCOME GAP
73.7/ 100
METRIC RATING
158th/ 347
METRIC RANK
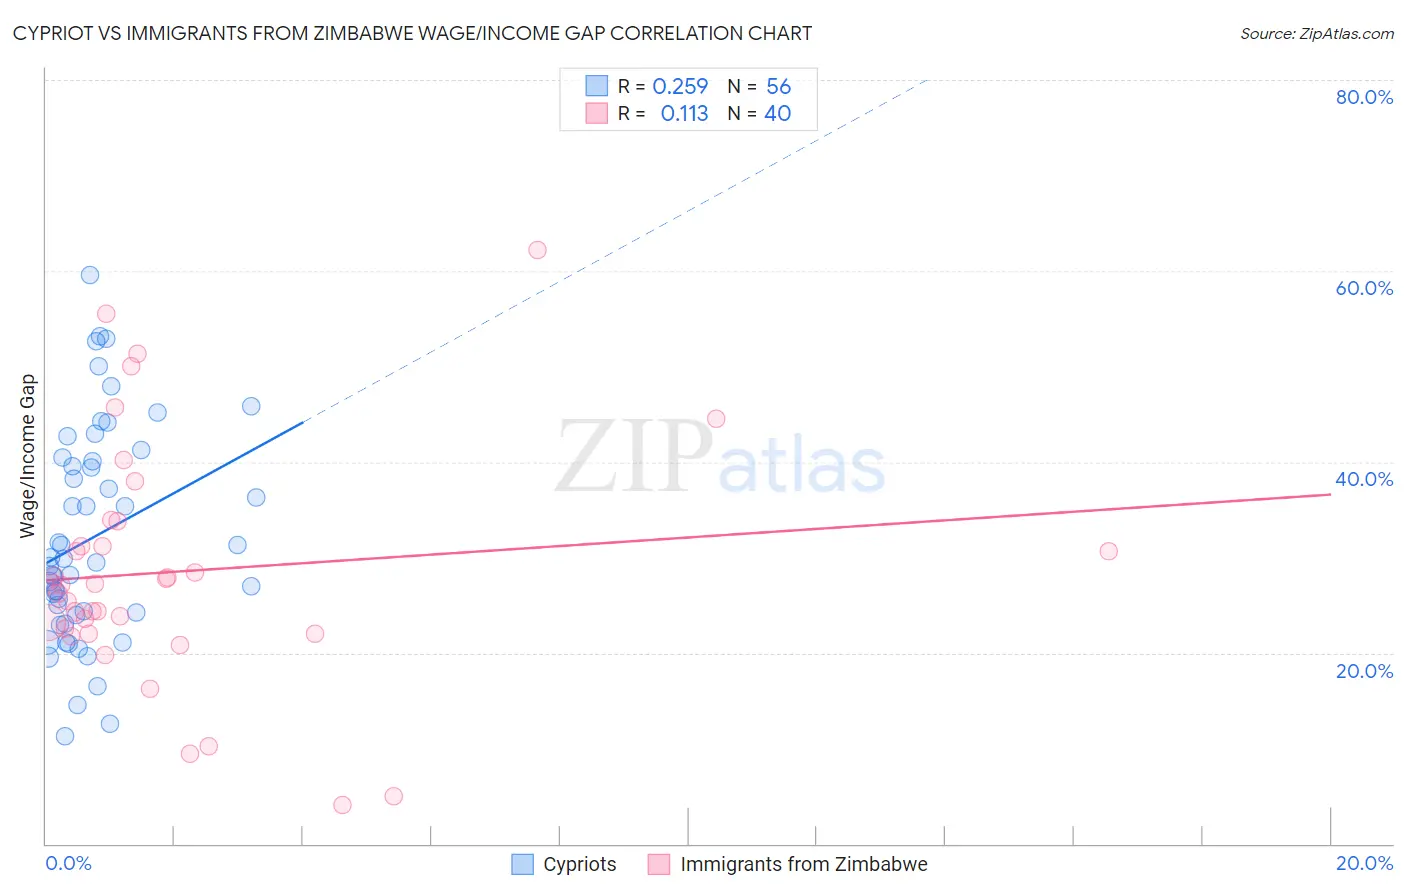
Cypriot vs Immigrants from Zimbabwe Wage/Income Gap Correlation Chart
The statistical analysis conducted on geographies consisting of 61,856,994 people shows a weak positive correlation between the proportion of Cypriots and wage/income gap percentage in the United States with a correlation coefficient (R) of 0.259 and weighted average of 27.3%. Similarly, the statistical analysis conducted on geographies consisting of 117,792,332 people shows a poor positive correlation between the proportion of Immigrants from Zimbabwe and wage/income gap percentage in the United States with a correlation coefficient (R) of 0.113 and weighted average of 25.3%, a difference of 7.6%.
Wage/Income Gap Correlation Summary
| Measurement | Cypriot | Immigrants from Zimbabwe |
| Minimum | 11.3% | 4.0% |
| Maximum | 59.6% | 62.1% |
| Range | 48.3% | 58.1% |
| Mean | 32.1% | 28.5% |
| Median | 29.6% | 27.1% |
| Interquartile 25% (IQ1) | 24.1% | 22.3% |
| Interquartile 75% (IQ3) | 40.2% | 32.5% |
| Interquartile Range (IQR) | 16.2% | 10.2% |
| Standard Deviation (Sample) | 11.2% | 12.6% |
| Standard Deviation (Population) | 11.1% | 12.4% |
Similar Demographics by Wage/Income Gap
Demographics Similar to Cypriots by Wage/Income Gap
In terms of wage/income gap, the demographic groups most similar to Cypriots are Carpatho Rusyn (27.3%, a difference of 0.0%), Celtic (27.3%, a difference of 0.010%), Immigrants from Czechoslovakia (27.3%, a difference of 0.020%), Immigrants from Norway (27.3%, a difference of 0.13%), and Ukrainian (27.3%, a difference of 0.19%).
| Demographics | Rating | Rank | Wage/Income Gap |
| Creek | 3.8 /100 | #241 | Tragic 27.1% |
| Immigrants | Sri Lanka | 3.7 /100 | #242 | Tragic 27.1% |
| Spanish | 3.6 /100 | #243 | Tragic 27.1% |
| Chickasaw | 3.5 /100 | #244 | Tragic 27.2% |
| Immigrants | Azores | 3.5 /100 | #245 | Tragic 27.2% |
| Immigrants | Nonimmigrants | 3.3 /100 | #246 | Tragic 27.2% |
| Celtics | 2.8 /100 | #247 | Tragic 27.3% |
| Cypriots | 2.8 /100 | #248 | Tragic 27.3% |
| Carpatho Rusyns | 2.7 /100 | #249 | Tragic 27.3% |
| Immigrants | Czechoslovakia | 2.7 /100 | #250 | Tragic 27.3% |
| Immigrants | Norway | 2.5 /100 | #251 | Tragic 27.3% |
| Ukrainians | 2.4 /100 | #252 | Tragic 27.3% |
| Portuguese | 2.2 /100 | #253 | Tragic 27.4% |
| Israelis | 2.1 /100 | #254 | Tragic 27.4% |
| Immigrants | France | 2.1 /100 | #255 | Tragic 27.4% |
Demographics Similar to Immigrants from Zimbabwe by Wage/Income Gap
In terms of wage/income gap, the demographic groups most similar to Immigrants from Zimbabwe are Puget Sound Salish (25.3%, a difference of 0.060%), French American Indian (25.4%, a difference of 0.10%), Costa Rican (25.3%, a difference of 0.18%), Immigrants from Mexico (25.3%, a difference of 0.24%), and Albanian (25.4%, a difference of 0.35%).
| Demographics | Rating | Rank | Wage/Income Gap |
| Taiwanese | 81.6 /100 | #151 | Excellent 25.1% |
| Uruguayans | 81.3 /100 | #152 | Excellent 25.2% |
| Blackfeet | 78.1 /100 | #153 | Good 25.2% |
| Immigrants | Northern Africa | 78.1 /100 | #154 | Good 25.2% |
| Immigrants | Vietnam | 77.7 /100 | #155 | Good 25.2% |
| Immigrants | Mexico | 76.4 /100 | #156 | Good 25.3% |
| Costa Ricans | 75.8 /100 | #157 | Good 25.3% |
| Immigrants | Zimbabwe | 73.7 /100 | #158 | Good 25.3% |
| Puget Sound Salish | 73.0 /100 | #159 | Good 25.3% |
| French American Indians | 72.5 /100 | #160 | Good 25.4% |
| Albanians | 69.4 /100 | #161 | Good 25.4% |
| Shoshone | 69.0 /100 | #162 | Good 25.4% |
| Native Hawaiians | 69.0 /100 | #163 | Good 25.4% |
| Koreans | 68.6 /100 | #164 | Good 25.4% |
| Immigrants | Hong Kong | 64.0 /100 | #165 | Good 25.5% |