Cypriot vs Immigrants from Zimbabwe Doctorate Degree
COMPARE
Cypriot
Immigrants from Zimbabwe
Doctorate Degree
Doctorate Degree Comparison
Cypriots
Immigrants from Zimbabwe
2.6%
DOCTORATE DEGREE
100.0/ 100
METRIC RATING
34th/ 347
METRIC RANK
2.2%
DOCTORATE DEGREE
99.4/ 100
METRIC RATING
87th/ 347
METRIC RANK
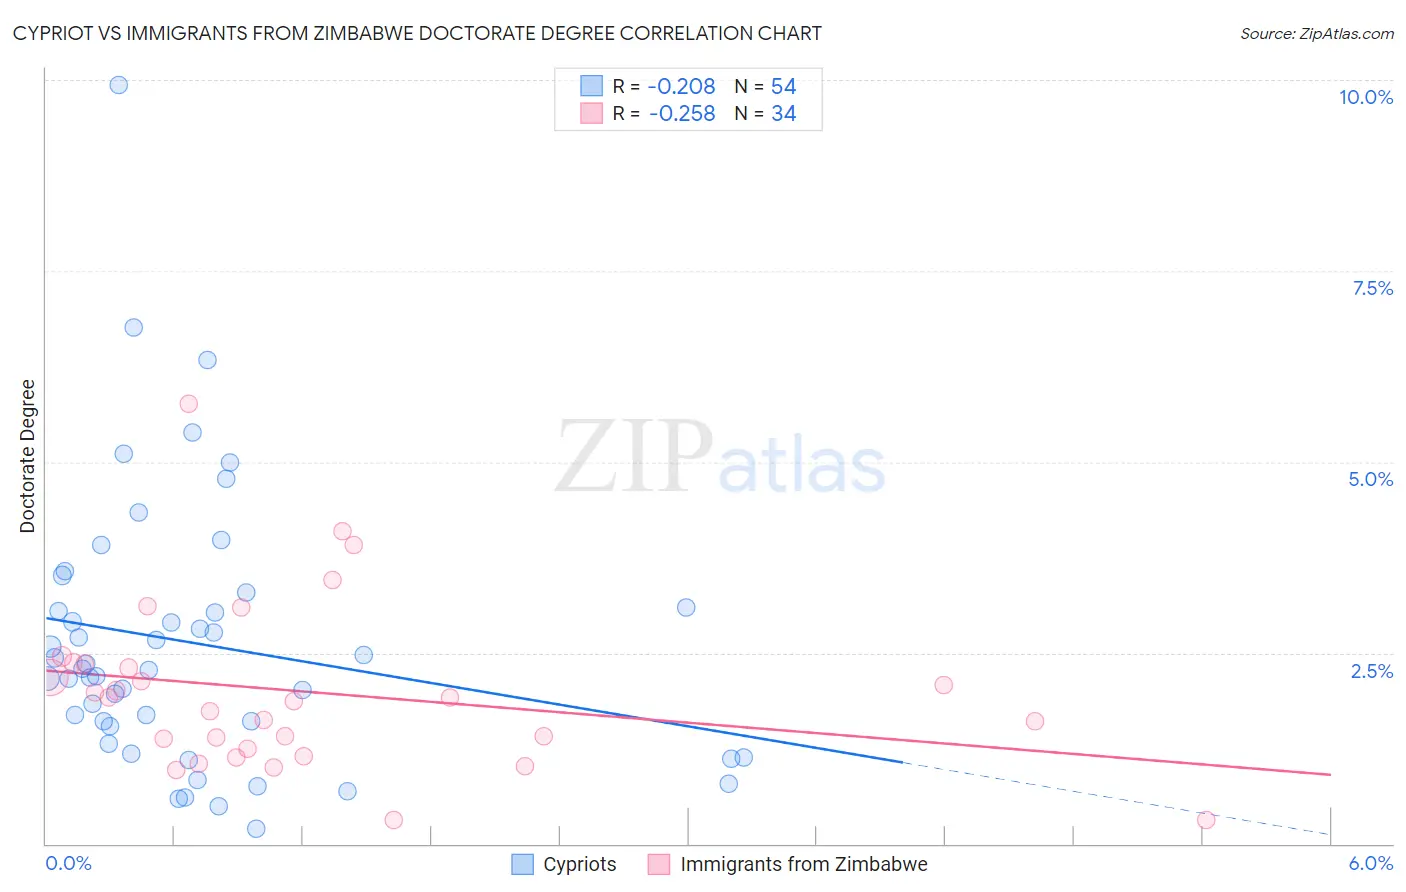
Cypriot vs Immigrants from Zimbabwe Doctorate Degree Correlation Chart
The statistical analysis conducted on geographies consisting of 61,785,676 people shows a weak negative correlation between the proportion of Cypriots and percentage of population with at least doctorate degree education in the United States with a correlation coefficient (R) of -0.208 and weighted average of 2.6%. Similarly, the statistical analysis conducted on geographies consisting of 117,524,590 people shows a weak negative correlation between the proportion of Immigrants from Zimbabwe and percentage of population with at least doctorate degree education in the United States with a correlation coefficient (R) of -0.258 and weighted average of 2.2%, a difference of 17.4%.
Doctorate Degree Correlation Summary
| Measurement | Cypriot | Immigrants from Zimbabwe |
| Minimum | 0.20% | 0.30% |
| Maximum | 9.9% | 5.8% |
| Range | 9.7% | 5.5% |
| Mean | 2.6% | 2.0% |
| Median | 2.3% | 1.9% |
| Interquartile 25% (IQ1) | 1.5% | 1.2% |
| Interquartile 75% (IQ3) | 3.1% | 2.4% |
| Interquartile Range (IQR) | 1.6% | 1.1% |
| Standard Deviation (Sample) | 1.8% | 1.1% |
| Standard Deviation (Population) | 1.8% | 1.1% |
Similar Demographics by Doctorate Degree
Demographics Similar to Cypriots by Doctorate Degree
In terms of doctorate degree, the demographic groups most similar to Cypriots are Immigrants from Malaysia (2.6%, a difference of 0.060%), Cambodian (2.6%, a difference of 0.11%), Immigrants from Spain (2.6%, a difference of 0.12%), Immigrants from Northern Europe (2.6%, a difference of 0.29%), and Immigrants from Kuwait (2.6%, a difference of 0.38%).
| Demographics | Rating | Rank | Doctorate Degree |
| Immigrants | Turkey | 100.0 /100 | #27 | Exceptional 2.6% |
| Burmese | 100.0 /100 | #28 | Exceptional 2.6% |
| Immigrants | South Central Asia | 100.0 /100 | #29 | Exceptional 2.6% |
| Immigrants | Korea | 100.0 /100 | #30 | Exceptional 2.6% |
| Latvians | 100.0 /100 | #31 | Exceptional 2.6% |
| Immigrants | Northern Europe | 100.0 /100 | #32 | Exceptional 2.6% |
| Cambodians | 100.0 /100 | #33 | Exceptional 2.6% |
| Cypriots | 100.0 /100 | #34 | Exceptional 2.6% |
| Immigrants | Malaysia | 100.0 /100 | #35 | Exceptional 2.6% |
| Immigrants | Spain | 100.0 /100 | #36 | Exceptional 2.6% |
| Immigrants | Kuwait | 100.0 /100 | #37 | Exceptional 2.6% |
| Russians | 100.0 /100 | #38 | Exceptional 2.6% |
| Immigrants | Ireland | 100.0 /100 | #39 | Exceptional 2.5% |
| Estonians | 100.0 /100 | #40 | Exceptional 2.5% |
| Immigrants | Russia | 100.0 /100 | #41 | Exceptional 2.5% |
Demographics Similar to Immigrants from Zimbabwe by Doctorate Degree
In terms of doctorate degree, the demographic groups most similar to Immigrants from Zimbabwe are Egyptian (2.2%, a difference of 0.11%), Immigrants from Nepal (2.2%, a difference of 0.36%), British (2.2%, a difference of 0.80%), Immigrants from Brazil (2.2%, a difference of 0.81%), and Immigrants from Scotland (2.2%, a difference of 0.82%).
| Demographics | Rating | Rank | Doctorate Degree |
| Ugandans | 99.7 /100 | #80 | Exceptional 2.2% |
| Immigrants | Argentina | 99.7 /100 | #81 | Exceptional 2.2% |
| Immigrants | Uganda | 99.6 /100 | #82 | Exceptional 2.2% |
| Immigrants | Lithuania | 99.6 /100 | #83 | Exceptional 2.2% |
| Immigrants | England | 99.6 /100 | #84 | Exceptional 2.2% |
| Immigrants | Brazil | 99.6 /100 | #85 | Exceptional 2.2% |
| Egyptians | 99.4 /100 | #86 | Exceptional 2.2% |
| Immigrants | Zimbabwe | 99.4 /100 | #87 | Exceptional 2.2% |
| Immigrants | Nepal | 99.3 /100 | #88 | Exceptional 2.2% |
| British | 99.3 /100 | #89 | Exceptional 2.2% |
| Immigrants | Scotland | 99.2 /100 | #90 | Exceptional 2.2% |
| Immigrants | Sudan | 99.1 /100 | #91 | Exceptional 2.2% |
| Chileans | 99.1 /100 | #92 | Exceptional 2.2% |
| Alsatians | 99.0 /100 | #93 | Exceptional 2.1% |
| Greeks | 98.8 /100 | #94 | Exceptional 2.1% |