Cypriot vs Immigrants from West Indies Disability Age Under 5
COMPARE
Cypriot
Immigrants from West Indies
Disability Age Under 5
Disability Age Under 5 Comparison
Cypriots
Immigrants from West Indies
1.3%
DISABILITY AGE UNDER 5
14.9/ 100
METRIC RATING
217th/ 347
METRIC RANK
1.2%
DISABILITY AGE UNDER 5
95.3/ 100
METRIC RATING
107th/ 347
METRIC RANK
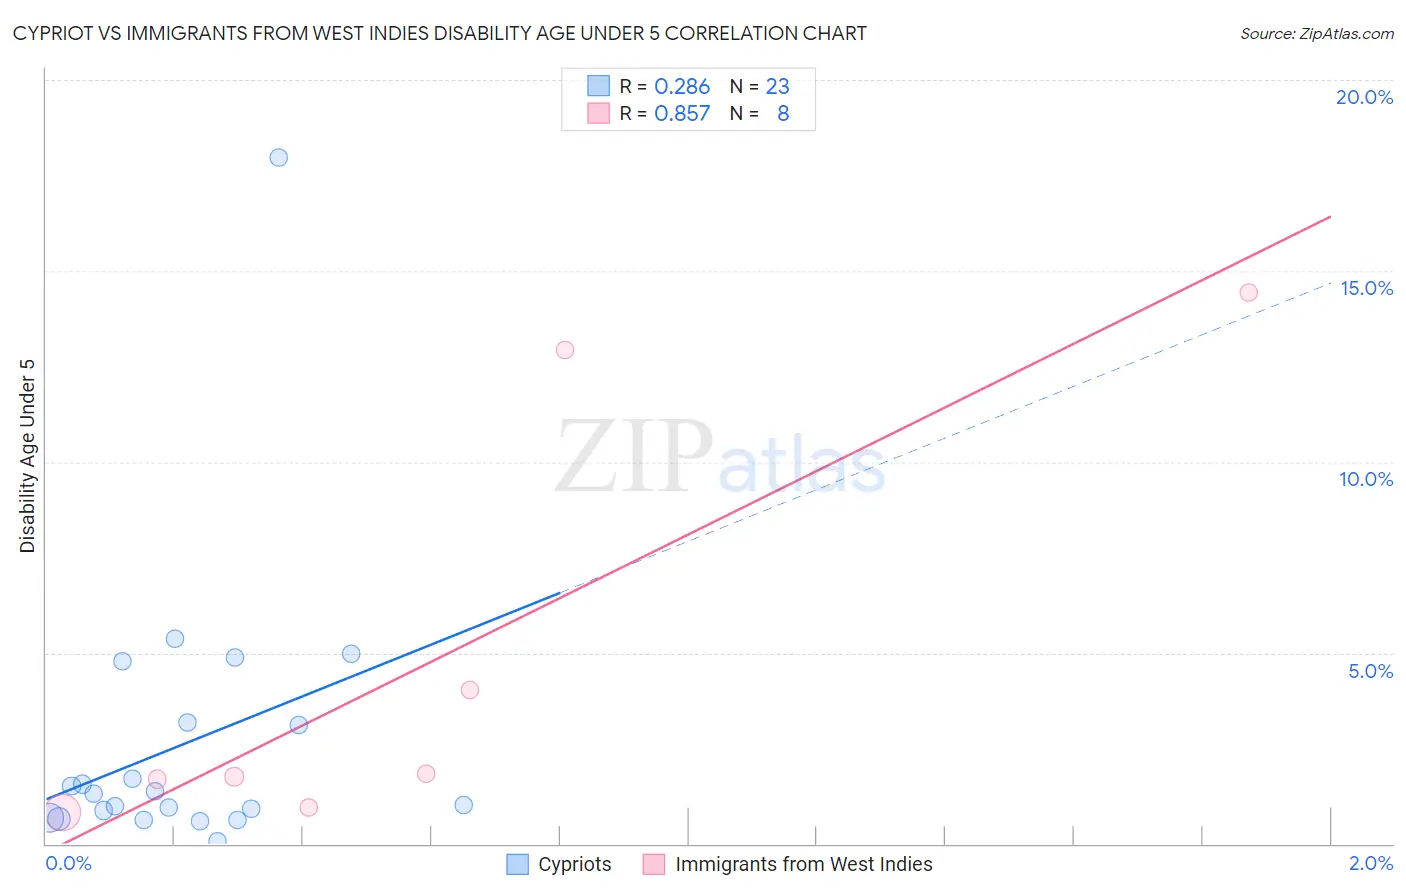
Cypriot vs Immigrants from West Indies Disability Age Under 5 Correlation Chart
The statistical analysis conducted on geographies consisting of 48,448,194 people shows a weak positive correlation between the proportion of Cypriots and percentage of population with a disability under the age of 5 in the United States with a correlation coefficient (R) of 0.286 and weighted average of 1.3%. Similarly, the statistical analysis conducted on geographies consisting of 56,449,609 people shows a very strong positive correlation between the proportion of Immigrants from West Indies and percentage of population with a disability under the age of 5 in the United States with a correlation coefficient (R) of 0.857 and weighted average of 1.2%, a difference of 11.5%.
Disability Age Under 5 Correlation Summary
| Measurement | Cypriot | Immigrants from West Indies |
| Minimum | 0.058% | 0.82% |
| Maximum | 18.0% | 14.4% |
| Range | 17.9% | 13.6% |
| Mean | 2.6% | 4.8% |
| Median | 1.3% | 1.8% |
| Interquartile 25% (IQ1) | 0.68% | 1.3% |
| Interquartile 75% (IQ3) | 3.2% | 8.5% |
| Interquartile Range (IQR) | 2.5% | 7.2% |
| Standard Deviation (Sample) | 3.7% | 5.6% |
| Standard Deviation (Population) | 3.6% | 5.2% |
Similar Demographics by Disability Age Under 5
Demographics Similar to Cypriots by Disability Age Under 5
In terms of disability age under 5, the demographic groups most similar to Cypriots are Bangladeshi (1.3%, a difference of 0.10%), Syrian (1.3%, a difference of 0.20%), Malaysian (1.3%, a difference of 0.31%), Immigrants from Chile (1.3%, a difference of 0.37%), and Immigrants from Sudan (1.3%, a difference of 0.60%).
| Demographics | Rating | Rank | Disability Age Under 5 |
| Pakistanis | 19.4 /100 | #210 | Poor 1.3% |
| Immigrants | Greece | 19.1 /100 | #211 | Poor 1.3% |
| Chileans | 18.8 /100 | #212 | Poor 1.3% |
| Immigrants | Sudan | 18.7 /100 | #213 | Poor 1.3% |
| Immigrants | Chile | 17.2 /100 | #214 | Poor 1.3% |
| Syrians | 16.1 /100 | #215 | Poor 1.3% |
| Bangladeshis | 15.5 /100 | #216 | Poor 1.3% |
| Cypriots | 14.9 /100 | #217 | Poor 1.3% |
| Malaysians | 13.2 /100 | #218 | Poor 1.3% |
| Immigrants | Croatia | 11.2 /100 | #219 | Poor 1.3% |
| Serbians | 9.6 /100 | #220 | Tragic 1.3% |
| Sub-Saharan Africans | 8.3 /100 | #221 | Tragic 1.3% |
| Ukrainians | 8.3 /100 | #222 | Tragic 1.3% |
| Hispanics or Latinos | 7.7 /100 | #223 | Tragic 1.3% |
| Latvians | 7.1 /100 | #224 | Tragic 1.3% |
Demographics Similar to Immigrants from West Indies by Disability Age Under 5
In terms of disability age under 5, the demographic groups most similar to Immigrants from West Indies are Cambodian (1.2%, a difference of 0.040%), Iraqi (1.2%, a difference of 0.13%), Immigrants from South Africa (1.2%, a difference of 0.14%), Immigrants from Panama (1.2%, a difference of 0.15%), and Immigrants from Lebanon (1.2%, a difference of 0.17%).
| Demographics | Rating | Rank | Disability Age Under 5 |
| Nicaraguans | 96.3 /100 | #100 | Exceptional 1.1% |
| Immigrants | Uganda | 96.1 /100 | #101 | Exceptional 1.1% |
| Immigrants | Morocco | 96.0 /100 | #102 | Exceptional 1.2% |
| Immigrants | Nicaragua | 96.0 /100 | #103 | Exceptional 1.2% |
| Indonesians | 95.9 /100 | #104 | Exceptional 1.2% |
| Immigrants | South Africa | 95.6 /100 | #105 | Exceptional 1.2% |
| Cambodians | 95.4 /100 | #106 | Exceptional 1.2% |
| Immigrants | West Indies | 95.3 /100 | #107 | Exceptional 1.2% |
| Iraqis | 95.1 /100 | #108 | Exceptional 1.2% |
| Immigrants | Panama | 95.0 /100 | #109 | Exceptional 1.2% |
| Immigrants | Lebanon | 95.0 /100 | #110 | Exceptional 1.2% |
| Senegalese | 94.6 /100 | #111 | Exceptional 1.2% |
| Immigrants | Australia | 94.4 /100 | #112 | Exceptional 1.2% |
| Immigrants | Oceania | 94.2 /100 | #113 | Exceptional 1.2% |
| Belizeans | 93.9 /100 | #114 | Exceptional 1.2% |