Immigrants from Eastern Africa vs U.S. Virgin Islander Median Family Income
COMPARE
Immigrants from Eastern Africa
U.S. Virgin Islander
Median Family Income
Median Family Income Comparison
Immigrants from Eastern Africa
U.S. Virgin Islanders
$102,451
MEDIAN FAMILY INCOME
47.1/ 100
METRIC RATING
175th/ 347
METRIC RANK
$85,294
MEDIAN FAMILY INCOME
0.0/ 100
METRIC RATING
308th/ 347
METRIC RANK
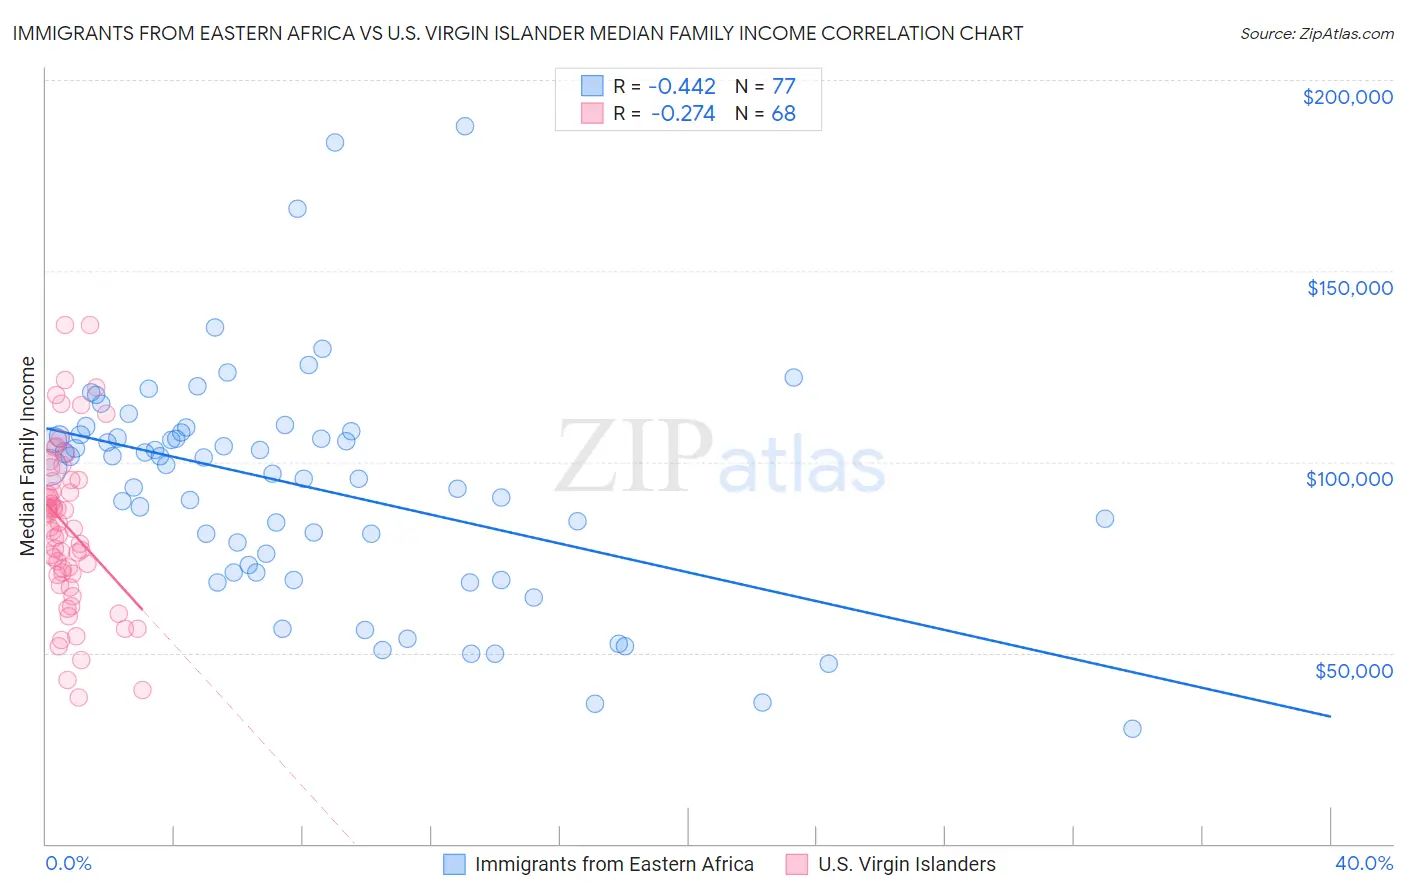
Immigrants from Eastern Africa vs U.S. Virgin Islander Median Family Income Correlation Chart
The statistical analysis conducted on geographies consisting of 354,805,172 people shows a moderate negative correlation between the proportion of Immigrants from Eastern Africa and median family income in the United States with a correlation coefficient (R) of -0.442 and weighted average of $102,451. Similarly, the statistical analysis conducted on geographies consisting of 87,505,006 people shows a weak negative correlation between the proportion of U.S. Virgin Islanders and median family income in the United States with a correlation coefficient (R) of -0.274 and weighted average of $85,294, a difference of 20.1%.
Median Family Income Correlation Summary
| Measurement | Immigrants from Eastern Africa | U.S. Virgin Islander |
| Minimum | $29,978 | $38,346 |
| Maximum | $188,047 | $136,000 |
| Range | $158,069 | $97,654 |
| Mean | $93,590 | $82,878 |
| Median | $99,122 | $82,757 |
| Interquartile 25% (IQ1) | $71,998 | $70,515 |
| Interquartile 75% (IQ3) | $107,333 | $95,033 |
| Interquartile Range (IQR) | $35,335 | $24,518 |
| Standard Deviation (Sample) | $29,714 | $21,454 |
| Standard Deviation (Population) | $29,520 | $21,296 |
Similar Demographics by Median Family Income
Demographics Similar to Immigrants from Eastern Africa by Median Family Income
In terms of median family income, the demographic groups most similar to Immigrants from Eastern Africa are French ($102,368, a difference of 0.080%), German ($102,254, a difference of 0.19%), Finnish ($102,676, a difference of 0.22%), Welsh ($102,151, a difference of 0.29%), and Belgian ($102,788, a difference of 0.33%).
| Demographics | Rating | Rank | Median Family Income |
| Immigrants | Peru | 60.8 /100 | #168 | Good $103,534 |
| Czechoslovakians | 57.6 /100 | #169 | Average $103,273 |
| Immigrants | Uzbekistan | 56.6 /100 | #170 | Average $103,197 |
| Alsatians | 54.3 /100 | #171 | Average $103,010 |
| Immigrants | Eritrea | 51.9 /100 | #172 | Average $102,823 |
| Belgians | 51.4 /100 | #173 | Average $102,788 |
| Finns | 50.0 /100 | #174 | Average $102,676 |
| Immigrants | Eastern Africa | 47.1 /100 | #175 | Average $102,451 |
| French | 46.1 /100 | #176 | Average $102,368 |
| Germans | 44.6 /100 | #177 | Average $102,254 |
| Welsh | 43.3 /100 | #178 | Average $102,151 |
| South Americans | 39.7 /100 | #179 | Fair $101,856 |
| French Canadians | 37.0 /100 | #180 | Fair $101,634 |
| Spaniards | 36.8 /100 | #181 | Fair $101,617 |
| Tsimshian | 35.9 /100 | #182 | Fair $101,543 |
Demographics Similar to U.S. Virgin Islanders by Median Family Income
In terms of median family income, the demographic groups most similar to U.S. Virgin Islanders are Chickasaw ($85,356, a difference of 0.070%), Haitian ($85,218, a difference of 0.090%), Paiute ($85,414, a difference of 0.14%), Immigrants from Dominica ($85,411, a difference of 0.14%), and Immigrants from Central America ($85,050, a difference of 0.29%).
| Demographics | Rating | Rank | Median Family Income |
| Colville | 0.0 /100 | #301 | Tragic $85,792 |
| Spanish American Indians | 0.0 /100 | #302 | Tragic $85,728 |
| Hispanics or Latinos | 0.0 /100 | #303 | Tragic $85,647 |
| Mexicans | 0.0 /100 | #304 | Tragic $85,618 |
| Paiute | 0.0 /100 | #305 | Tragic $85,414 |
| Immigrants | Dominica | 0.0 /100 | #306 | Tragic $85,411 |
| Chickasaw | 0.0 /100 | #307 | Tragic $85,356 |
| U.S. Virgin Islanders | 0.0 /100 | #308 | Tragic $85,294 |
| Haitians | 0.0 /100 | #309 | Tragic $85,218 |
| Immigrants | Central America | 0.0 /100 | #310 | Tragic $85,050 |
| Hondurans | 0.0 /100 | #311 | Tragic $85,004 |
| Cubans | 0.0 /100 | #312 | Tragic $84,981 |
| Choctaw | 0.0 /100 | #313 | Tragic $84,835 |
| Immigrants | Bahamas | 0.0 /100 | #314 | Tragic $84,732 |
| Apache | 0.0 /100 | #315 | Tragic $84,451 |