Yugoslavian vs Immigrants from Nepal Median Family Income
COMPARE
Yugoslavian
Immigrants from Nepal
Median Family Income
Median Family Income Comparison
Yugoslavians
Immigrants from Nepal
$100,119
MEDIAN FAMILY INCOME
21.3/ 100
METRIC RATING
199th/ 347
METRIC RANK
$104,966
MEDIAN FAMILY INCOME
76.3/ 100
METRIC RATING
154th/ 347
METRIC RANK
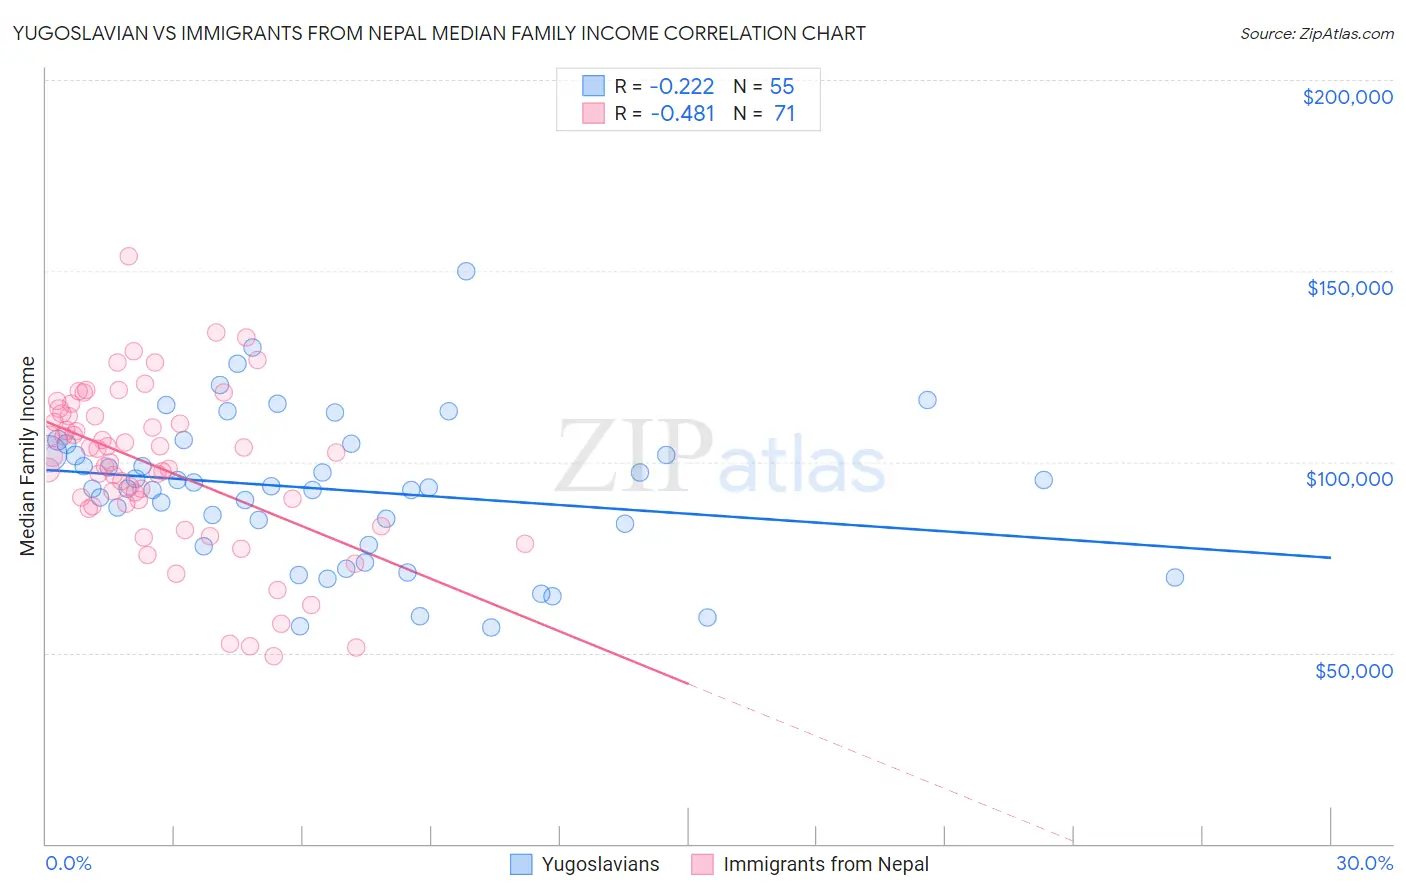
Yugoslavian vs Immigrants from Nepal Median Family Income Correlation Chart
The statistical analysis conducted on geographies consisting of 285,576,130 people shows a weak negative correlation between the proportion of Yugoslavians and median family income in the United States with a correlation coefficient (R) of -0.222 and weighted average of $100,119. Similarly, the statistical analysis conducted on geographies consisting of 186,649,398 people shows a moderate negative correlation between the proportion of Immigrants from Nepal and median family income in the United States with a correlation coefficient (R) of -0.481 and weighted average of $104,966, a difference of 4.8%.
Median Family Income Correlation Summary
| Measurement | Yugoslavian | Immigrants from Nepal |
| Minimum | $56,660 | $49,167 |
| Maximum | $150,000 | $153,934 |
| Range | $93,340 | $104,767 |
| Mean | $92,781 | $98,602 |
| Median | $93,214 | $101,530 |
| Interquartile 25% (IQ1) | $78,167 | $88,483 |
| Interquartile 75% (IQ3) | $104,589 | $112,054 |
| Interquartile Range (IQR) | $26,422 | $23,571 |
| Standard Deviation (Sample) | $19,367 | $21,122 |
| Standard Deviation (Population) | $19,191 | $20,972 |
Similar Demographics by Median Family Income
Demographics Similar to Yugoslavians by Median Family Income
In terms of median family income, the demographic groups most similar to Yugoslavians are Immigrants from Africa ($100,256, a difference of 0.14%), Spanish ($99,977, a difference of 0.14%), Immigrants from Cameroon ($100,289, a difference of 0.17%), Samoan ($100,344, a difference of 0.22%), and Immigrants from Thailand ($99,840, a difference of 0.28%).
| Demographics | Rating | Rank | Median Family Income |
| Immigrants | Kenya | 26.5 /100 | #192 | Fair $100,679 |
| Iraqis | 26.3 /100 | #193 | Fair $100,658 |
| Uruguayans | 26.3 /100 | #194 | Fair $100,656 |
| Immigrants | South America | 23.9 /100 | #195 | Fair $100,414 |
| Samoans | 23.3 /100 | #196 | Fair $100,344 |
| Immigrants | Cameroon | 22.8 /100 | #197 | Fair $100,289 |
| Immigrants | Africa | 22.5 /100 | #198 | Fair $100,256 |
| Yugoslavians | 21.3 /100 | #199 | Fair $100,119 |
| Spanish | 20.1 /100 | #200 | Fair $99,977 |
| Immigrants | Thailand | 19.0 /100 | #201 | Poor $99,840 |
| Whites/Caucasians | 18.7 /100 | #202 | Poor $99,800 |
| Scotch-Irish | 17.1 /100 | #203 | Poor $99,591 |
| Ghanaians | 12.6 /100 | #204 | Poor $98,877 |
| Hawaiians | 12.5 /100 | #205 | Poor $98,869 |
| Immigrants | Iraq | 12.1 /100 | #206 | Poor $98,786 |
Demographics Similar to Immigrants from Nepal by Median Family Income
In terms of median family income, the demographic groups most similar to Immigrants from Nepal are Native Hawaiian ($104,910, a difference of 0.050%), Slavic ($105,144, a difference of 0.17%), Basque ($104,760, a difference of 0.20%), Immigrants from Albania ($105,285, a difference of 0.30%), and Peruvian ($105,444, a difference of 0.45%).
| Demographics | Rating | Rank | Median Family Income |
| Immigrants | Chile | 82.1 /100 | #147 | Excellent $105,655 |
| Hungarians | 81.7 /100 | #148 | Excellent $105,609 |
| Immigrants | Germany | 80.9 /100 | #149 | Excellent $105,507 |
| Irish | 80.5 /100 | #150 | Excellent $105,453 |
| Peruvians | 80.4 /100 | #151 | Excellent $105,444 |
| Immigrants | Albania | 79.1 /100 | #152 | Good $105,285 |
| Slavs | 77.9 /100 | #153 | Good $105,144 |
| Immigrants | Nepal | 76.3 /100 | #154 | Good $104,966 |
| Native Hawaiians | 75.8 /100 | #155 | Good $104,910 |
| Basques | 74.4 /100 | #156 | Good $104,760 |
| Moroccans | 71.6 /100 | #157 | Good $104,488 |
| Scandinavians | 70.8 /100 | #158 | Good $104,410 |
| Swiss | 70.7 /100 | #159 | Good $104,396 |
| Scottish | 69.5 /100 | #160 | Good $104,288 |
| Icelanders | 69.4 /100 | #161 | Good $104,282 |