Cuban vs Immigrants from Greece Female Unemployment
COMPARE
Cuban
Immigrants from Greece
Female Unemployment
Female Unemployment Comparison
Cubans
Immigrants from Greece
4.9%
FEMALE UNEMPLOYMENT
98.3/ 100
METRIC RATING
67th/ 347
METRIC RANK
5.2%
FEMALE UNEMPLOYMENT
74.9/ 100
METRIC RATING
153rd/ 347
METRIC RANK
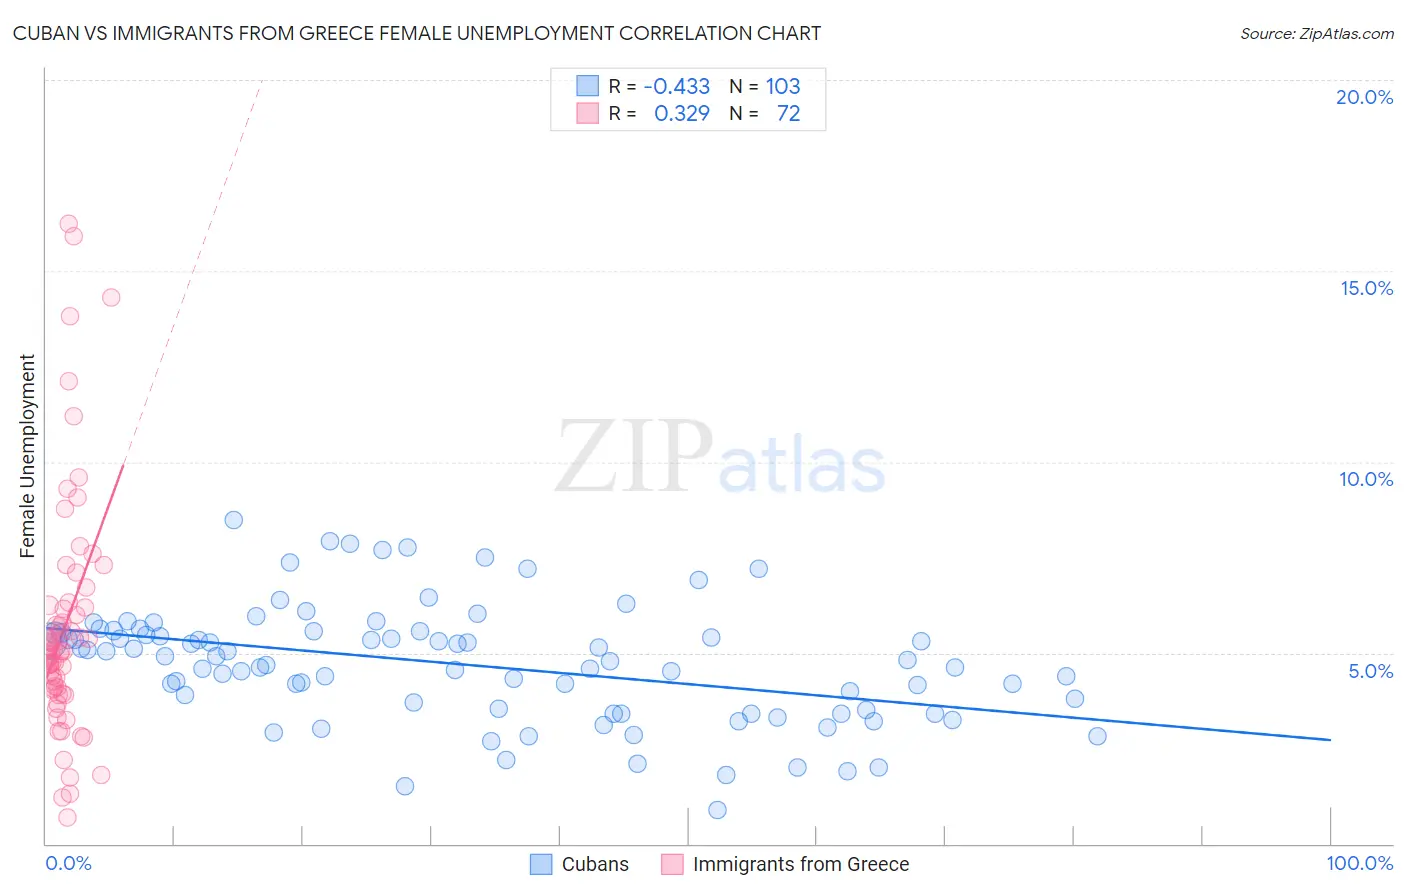
Cuban vs Immigrants from Greece Female Unemployment Correlation Chart
The statistical analysis conducted on geographies consisting of 446,472,096 people shows a moderate negative correlation between the proportion of Cubans and unemploymnet rate among females in the United States with a correlation coefficient (R) of -0.433 and weighted average of 4.9%. Similarly, the statistical analysis conducted on geographies consisting of 216,457,402 people shows a mild positive correlation between the proportion of Immigrants from Greece and unemploymnet rate among females in the United States with a correlation coefficient (R) of 0.329 and weighted average of 5.2%, a difference of 4.7%.
Female Unemployment Correlation Summary
| Measurement | Cuban | Immigrants from Greece |
| Minimum | 0.90% | 0.70% |
| Maximum | 8.5% | 16.2% |
| Range | 7.6% | 15.5% |
| Mean | 4.7% | 5.7% |
| Median | 4.8% | 5.0% |
| Interquartile 25% (IQ1) | 3.5% | 4.0% |
| Interquartile 75% (IQ3) | 5.5% | 6.2% |
| Interquartile Range (IQR) | 2.0% | 2.2% |
| Standard Deviation (Sample) | 1.5% | 3.1% |
| Standard Deviation (Population) | 1.5% | 3.1% |
Similar Demographics by Female Unemployment
Demographics Similar to Cubans by Female Unemployment
In terms of female unemployment, the demographic groups most similar to Cubans are Hungarian (4.9%, a difference of 0.0%), Tlingit-Haida (4.9%, a difference of 0.010%), Immigrants from Ireland (4.9%, a difference of 0.020%), Immigrants from North America (4.9%, a difference of 0.030%), and Osage (4.9%, a difference of 0.060%).
| Demographics | Rating | Rank | Female Unemployment |
| Immigrants | Scotland | 98.6 /100 | #60 | Exceptional 4.9% |
| Immigrants | Canada | 98.6 /100 | #61 | Exceptional 4.9% |
| Immigrants | Nepal | 98.6 /100 | #62 | Exceptional 4.9% |
| Immigrants | Belgium | 98.5 /100 | #63 | Exceptional 4.9% |
| Celtics | 98.5 /100 | #64 | Exceptional 4.9% |
| Immigrants | North America | 98.3 /100 | #65 | Exceptional 4.9% |
| Hungarians | 98.3 /100 | #66 | Exceptional 4.9% |
| Cubans | 98.3 /100 | #67 | Exceptional 4.9% |
| Tlingit-Haida | 98.3 /100 | #68 | Exceptional 4.9% |
| Immigrants | Ireland | 98.2 /100 | #69 | Exceptional 4.9% |
| Osage | 98.2 /100 | #70 | Exceptional 4.9% |
| German Russians | 98.1 /100 | #71 | Exceptional 4.9% |
| Immigrants | Northern Europe | 98.0 /100 | #72 | Exceptional 4.9% |
| Russians | 98.0 /100 | #73 | Exceptional 5.0% |
| Immigrants | Bolivia | 98.0 /100 | #74 | Exceptional 5.0% |
Demographics Similar to Immigrants from Greece by Female Unemployment
In terms of female unemployment, the demographic groups most similar to Immigrants from Greece are Immigrants from Italy (5.2%, a difference of 0.010%), Immigrants from China (5.2%, a difference of 0.080%), Egyptian (5.2%, a difference of 0.29%), Asian (5.2%, a difference of 0.30%), and South African (5.2%, a difference of 0.32%).
| Demographics | Rating | Rank | Female Unemployment |
| Immigrants | Norway | 79.4 /100 | #146 | Good 5.2% |
| Argentineans | 79.2 /100 | #147 | Good 5.2% |
| Immigrants | Argentina | 78.7 /100 | #148 | Good 5.2% |
| Asians | 78.3 /100 | #149 | Good 5.2% |
| Egyptians | 78.3 /100 | #150 | Good 5.2% |
| Immigrants | China | 75.9 /100 | #151 | Good 5.2% |
| Immigrants | Italy | 75.0 /100 | #152 | Good 5.2% |
| Immigrants | Greece | 74.9 /100 | #153 | Good 5.2% |
| South Africans | 70.8 /100 | #154 | Good 5.2% |
| Immigrants | Egypt | 70.0 /100 | #155 | Good 5.2% |
| Immigrants | Northern Africa | 69.6 /100 | #156 | Good 5.2% |
| Immigrants | Russia | 69.3 /100 | #157 | Good 5.2% |
| Albanians | 68.3 /100 | #158 | Good 5.2% |
| Immigrants | Micronesia | 66.9 /100 | #159 | Good 5.2% |
| Immigrants | Spain | 66.8 /100 | #160 | Good 5.2% |