Cree vs Immigrants from Cabo Verde Currently Married
COMPARE
Cree
Immigrants from Cabo Verde
Currently Married
Currently Married Comparison
Cree
Immigrants from Cabo Verde
44.9%
CURRENTLY MARRIED
1.7/ 100
METRIC RATING
229th/ 347
METRIC RANK
37.8%
CURRENTLY MARRIED
0.0/ 100
METRIC RATING
344th/ 347
METRIC RANK
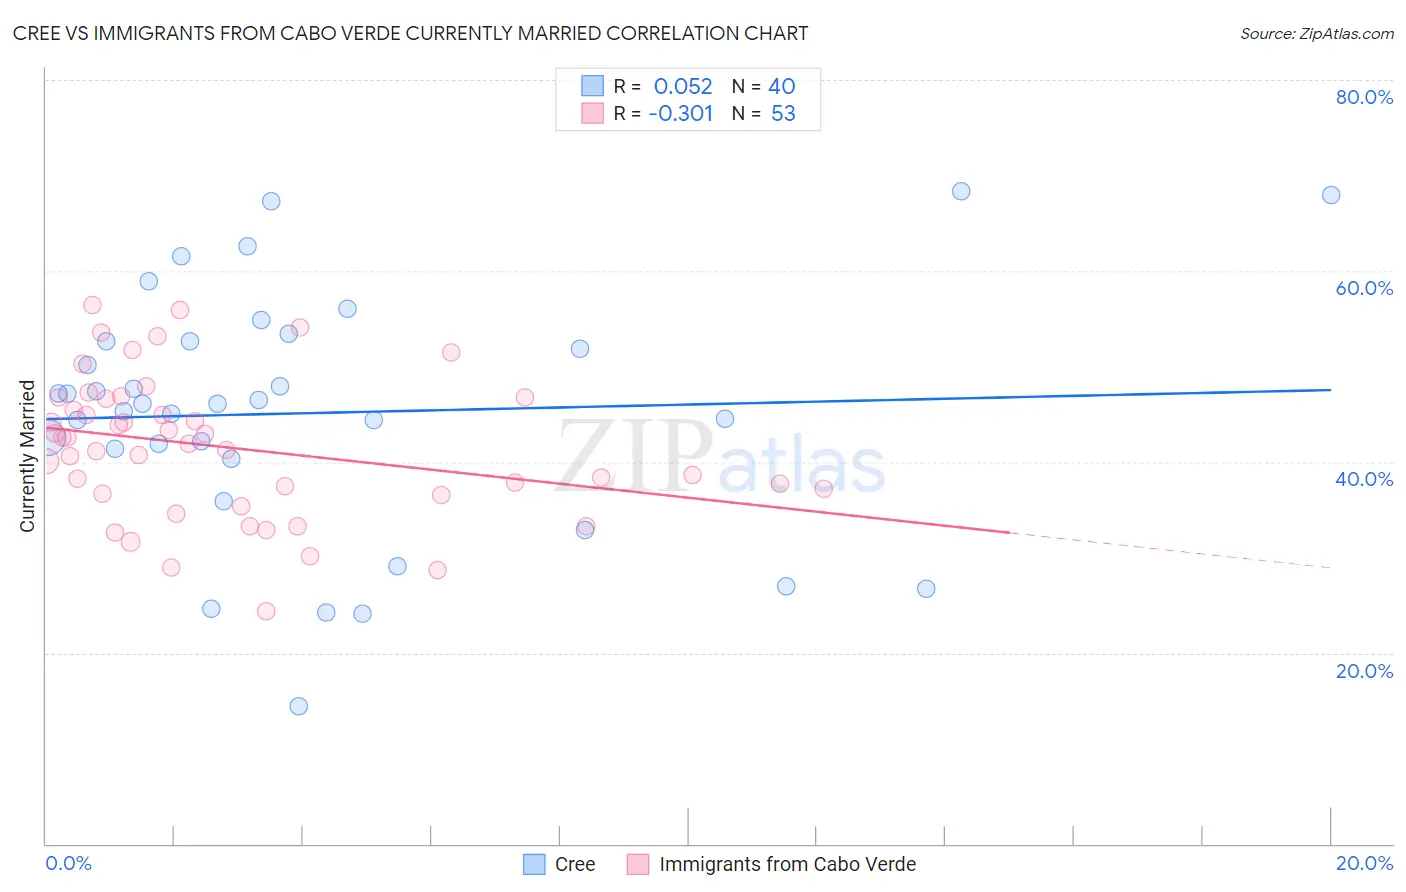
Cree vs Immigrants from Cabo Verde Currently Married Correlation Chart
The statistical analysis conducted on geographies consisting of 76,211,685 people shows a slight positive correlation between the proportion of Cree and percentage of population currently married in the United States with a correlation coefficient (R) of 0.052 and weighted average of 44.9%. Similarly, the statistical analysis conducted on geographies consisting of 38,158,666 people shows a mild negative correlation between the proportion of Immigrants from Cabo Verde and percentage of population currently married in the United States with a correlation coefficient (R) of -0.301 and weighted average of 37.8%, a difference of 18.7%.
Currently Married Correlation Summary
| Measurement | Cree | Immigrants from Cabo Verde |
| Minimum | 14.4% | 24.4% |
| Maximum | 68.3% | 56.5% |
| Range | 53.9% | 32.1% |
| Mean | 45.1% | 41.5% |
| Median | 46.1% | 41.9% |
| Interquartile 25% (IQ1) | 40.8% | 36.6% |
| Interquartile 75% (IQ3) | 52.6% | 46.7% |
| Interquartile Range (IQR) | 11.8% | 10.1% |
| Standard Deviation (Sample) | 12.7% | 7.4% |
| Standard Deviation (Population) | 12.5% | 7.3% |
Similar Demographics by Currently Married
Demographics Similar to Cree by Currently Married
In terms of currently married, the demographic groups most similar to Cree are Immigrants from Kenya (44.9%, a difference of 0.040%), Immigrants from Panama (44.9%, a difference of 0.080%), Spanish American (45.0%, a difference of 0.19%), Immigrants from Uruguay (45.0%, a difference of 0.19%), and Comanche (45.0%, a difference of 0.20%).
| Demographics | Rating | Rank | Currently Married |
| Immigrants | Azores | 2.5 /100 | #222 | Tragic 45.1% |
| Immigrants | Laos | 2.3 /100 | #223 | Tragic 45.0% |
| Immigrants | Uganda | 2.2 /100 | #224 | Tragic 45.0% |
| French American Indians | 2.2 /100 | #225 | Tragic 45.0% |
| Comanche | 2.1 /100 | #226 | Tragic 45.0% |
| Spanish Americans | 2.1 /100 | #227 | Tragic 45.0% |
| Immigrants | Uruguay | 2.0 /100 | #228 | Tragic 45.0% |
| Cree | 1.7 /100 | #229 | Tragic 44.9% |
| Immigrants | Kenya | 1.6 /100 | #230 | Tragic 44.9% |
| Immigrants | Panama | 1.5 /100 | #231 | Tragic 44.9% |
| Nepalese | 1.2 /100 | #232 | Tragic 44.7% |
| Immigrants | Saudi Arabia | 1.1 /100 | #233 | Tragic 44.7% |
| Iroquois | 1.1 /100 | #234 | Tragic 44.7% |
| Alaskan Athabascans | 0.9 /100 | #235 | Tragic 44.6% |
| Cubans | 0.9 /100 | #236 | Tragic 44.6% |
Demographics Similar to Immigrants from Cabo Verde by Currently Married
In terms of currently married, the demographic groups most similar to Immigrants from Cabo Verde are Pueblo (38.2%, a difference of 1.1%), Tohono O'odham (36.8%, a difference of 2.9%), Immigrants from Dominican Republic (38.9%, a difference of 2.9%), Navajo (39.0%, a difference of 3.1%), and Immigrants from Grenada (39.1%, a difference of 3.5%).
| Demographics | Rating | Rank | Currently Married |
| Yup'ik | 0.0 /100 | #333 | Tragic 39.9% |
| Puerto Ricans | 0.0 /100 | #334 | Tragic 39.9% |
| Lumbee | 0.0 /100 | #335 | Tragic 39.8% |
| British West Indians | 0.0 /100 | #336 | Tragic 39.8% |
| Blacks/African Americans | 0.0 /100 | #337 | Tragic 39.6% |
| Cape Verdeans | 0.0 /100 | #338 | Tragic 39.6% |
| Dominicans | 0.0 /100 | #339 | Tragic 39.5% |
| Immigrants | Grenada | 0.0 /100 | #340 | Tragic 39.1% |
| Navajo | 0.0 /100 | #341 | Tragic 39.0% |
| Immigrants | Dominican Republic | 0.0 /100 | #342 | Tragic 38.9% |
| Pueblo | 0.0 /100 | #343 | Tragic 38.2% |
| Immigrants | Cabo Verde | 0.0 /100 | #344 | Tragic 37.8% |
| Tohono O'odham | 0.0 /100 | #345 | Tragic 36.8% |
| Hopi | 0.0 /100 | #346 | Tragic 36.5% |
| Pima | 0.0 /100 | #347 | Tragic 35.9% |