Cree vs Immigrants from Cabo Verde Median Family Income
COMPARE
Cree
Immigrants from Cabo Verde
Median Family Income
Median Family Income Comparison
Cree
Immigrants from Cabo Verde
$90,882
MEDIAN FAMILY INCOME
0.2/ 100
METRIC RATING
268th/ 347
METRIC RANK
$87,830
MEDIAN FAMILY INCOME
0.1/ 100
METRIC RATING
291st/ 347
METRIC RANK
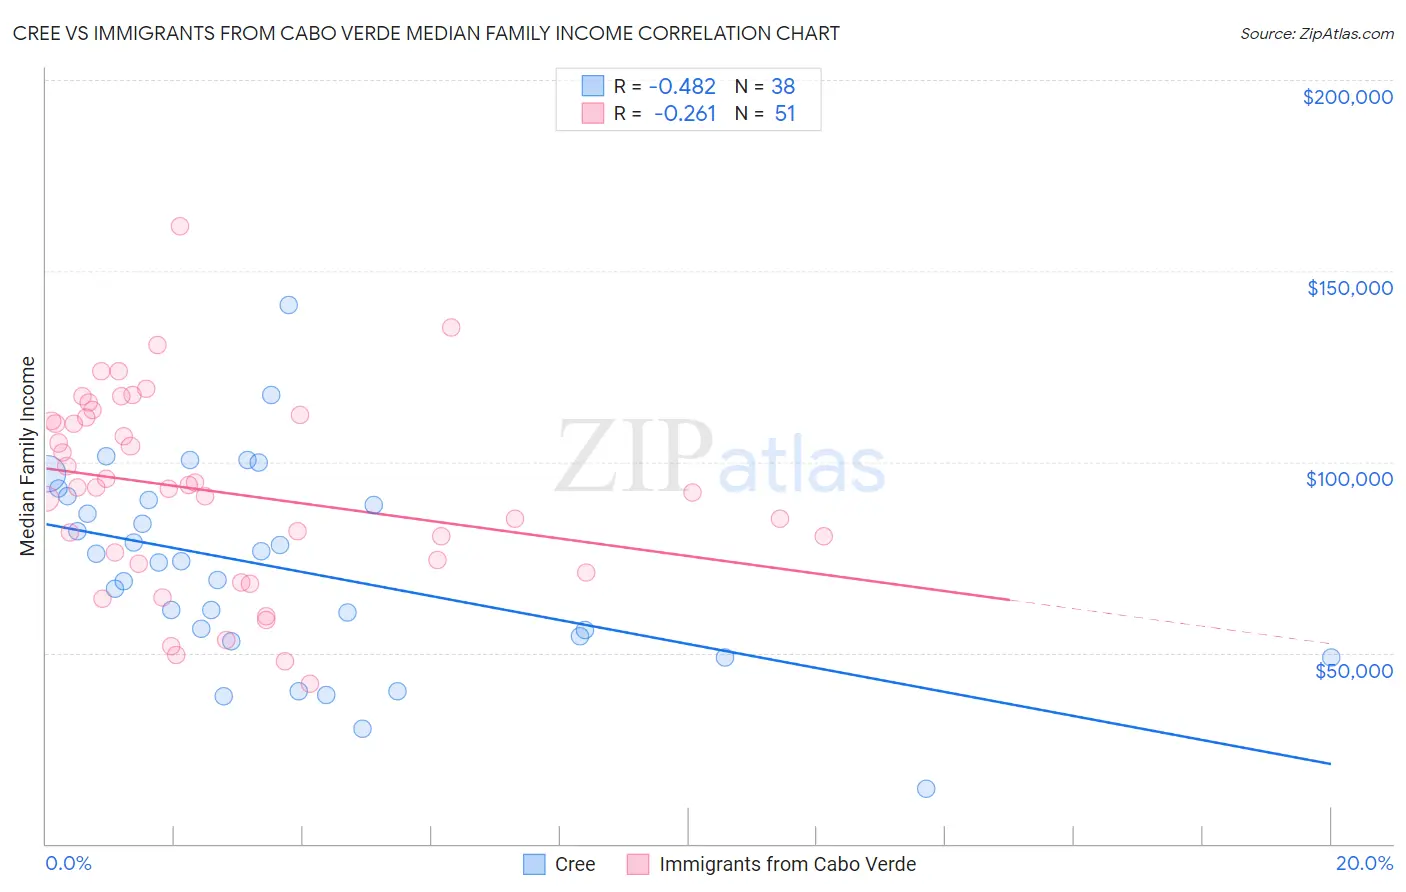
Cree vs Immigrants from Cabo Verde Median Family Income Correlation Chart
The statistical analysis conducted on geographies consisting of 76,200,070 people shows a moderate negative correlation between the proportion of Cree and median family income in the United States with a correlation coefficient (R) of -0.482 and weighted average of $90,882. Similarly, the statistical analysis conducted on geographies consisting of 38,130,720 people shows a weak negative correlation between the proportion of Immigrants from Cabo Verde and median family income in the United States with a correlation coefficient (R) of -0.261 and weighted average of $87,830, a difference of 3.5%.
Median Family Income Correlation Summary
| Measurement | Cree | Immigrants from Cabo Verde |
| Minimum | $14,519 | $41,875 |
| Maximum | $140,987 | $161,685 |
| Range | $126,468 | $119,810 |
| Mean | $71,996 | $92,155 |
| Median | $73,827 | $93,152 |
| Interquartile 25% (IQ1) | $54,375 | $73,200 |
| Interquartile 75% (IQ3) | $90,158 | $111,657 |
| Interquartile Range (IQR) | $35,783 | $38,457 |
| Standard Deviation (Sample) | $25,840 | $25,505 |
| Standard Deviation (Population) | $25,498 | $25,254 |
Similar Demographics by Median Family Income
Demographics Similar to Cree by Median Family Income
In terms of median family income, the demographic groups most similar to Cree are Belizean ($90,880, a difference of 0.0%), Mexican American Indian ($90,918, a difference of 0.040%), Central American ($91,087, a difference of 0.23%), Jamaican ($90,581, a difference of 0.33%), and Iroquois ($90,543, a difference of 0.37%).
| Demographics | Rating | Rank | Median Family Income |
| Inupiat | 0.4 /100 | #261 | Tragic $91,730 |
| Liberians | 0.4 /100 | #262 | Tragic $91,722 |
| Immigrants | West Indies | 0.3 /100 | #263 | Tragic $91,588 |
| Senegalese | 0.3 /100 | #264 | Tragic $91,475 |
| Hmong | 0.3 /100 | #265 | Tragic $91,296 |
| Central Americans | 0.3 /100 | #266 | Tragic $91,087 |
| Mexican American Indians | 0.2 /100 | #267 | Tragic $90,918 |
| Cree | 0.2 /100 | #268 | Tragic $90,882 |
| Belizeans | 0.2 /100 | #269 | Tragic $90,880 |
| Jamaicans | 0.2 /100 | #270 | Tragic $90,581 |
| Iroquois | 0.2 /100 | #271 | Tragic $90,543 |
| Immigrants | Liberia | 0.2 /100 | #272 | Tragic $90,450 |
| Immigrants | Micronesia | 0.2 /100 | #273 | Tragic $90,345 |
| Spanish Americans | 0.2 /100 | #274 | Tragic $90,322 |
| Immigrants | St. Vincent and the Grenadines | 0.2 /100 | #275 | Tragic $90,094 |
Demographics Similar to Immigrants from Cabo Verde by Median Family Income
In terms of median family income, the demographic groups most similar to Immigrants from Cabo Verde are African ($87,820, a difference of 0.010%), Shoshone ($87,872, a difference of 0.050%), Central American Indian ($88,034, a difference of 0.23%), Ute ($87,596, a difference of 0.27%), and Cherokee ($88,209, a difference of 0.43%).
| Demographics | Rating | Rank | Median Family Income |
| Indonesians | 0.1 /100 | #284 | Tragic $88,301 |
| Guatemalans | 0.1 /100 | #285 | Tragic $88,295 |
| Immigrants | Nicaragua | 0.1 /100 | #286 | Tragic $88,267 |
| Potawatomi | 0.1 /100 | #287 | Tragic $88,265 |
| Cherokee | 0.1 /100 | #288 | Tragic $88,209 |
| Central American Indians | 0.1 /100 | #289 | Tragic $88,034 |
| Shoshone | 0.1 /100 | #290 | Tragic $87,872 |
| Immigrants | Cabo Verde | 0.1 /100 | #291 | Tragic $87,830 |
| Africans | 0.1 /100 | #292 | Tragic $87,820 |
| Ute | 0.0 /100 | #293 | Tragic $87,596 |
| Fijians | 0.0 /100 | #294 | Tragic $87,387 |
| Yaqui | 0.0 /100 | #295 | Tragic $87,289 |
| Immigrants | Guatemala | 0.0 /100 | #296 | Tragic $87,191 |
| Cajuns | 0.0 /100 | #297 | Tragic $87,157 |
| Immigrants | Latin America | 0.0 /100 | #298 | Tragic $86,989 |