Jamaican vs Immigrants from Cabo Verde Median Female Earnings
COMPARE
Jamaican
Immigrants from Cabo Verde
Median Female Earnings
Median Female Earnings Comparison
Jamaicans
Immigrants from Cabo Verde
$38,670
MEDIAN FEMALE EARNINGS
10.5/ 100
METRIC RATING
213th/ 347
METRIC RANK
$38,208
MEDIAN FEMALE EARNINGS
4.3/ 100
METRIC RATING
237th/ 347
METRIC RANK
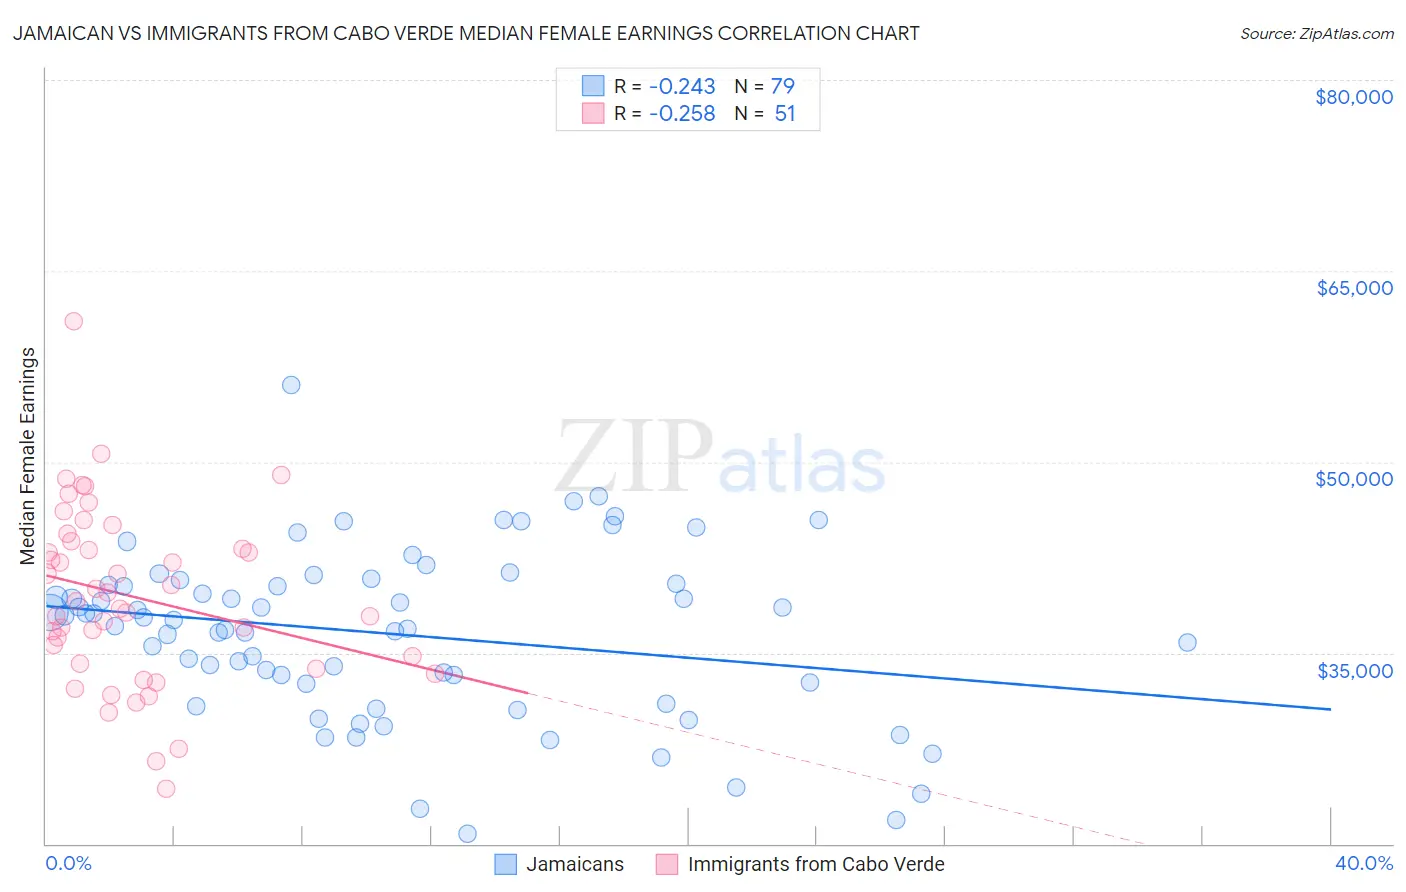
Jamaican vs Immigrants from Cabo Verde Median Female Earnings Correlation Chart
The statistical analysis conducted on geographies consisting of 367,929,945 people shows a weak negative correlation between the proportion of Jamaicans and median female earnings in the United States with a correlation coefficient (R) of -0.243 and weighted average of $38,670. Similarly, the statistical analysis conducted on geographies consisting of 38,158,316 people shows a weak negative correlation between the proportion of Immigrants from Cabo Verde and median female earnings in the United States with a correlation coefficient (R) of -0.258 and weighted average of $38,208, a difference of 1.2%.
Median Female Earnings Correlation Summary
| Measurement | Jamaican | Immigrants from Cabo Verde |
| Minimum | $20,833 | $24,340 |
| Maximum | $56,012 | $61,096 |
| Range | $35,179 | $36,756 |
| Mean | $36,507 | $39,427 |
| Median | $37,552 | $39,071 |
| Interquartile 25% (IQ1) | $32,539 | $34,187 |
| Interquartile 75% (IQ3) | $40,387 | $43,779 |
| Interquartile Range (IQR) | $7,848 | $9,592 |
| Standard Deviation (Sample) | $6,597 | $6,953 |
| Standard Deviation (Population) | $6,555 | $6,885 |
Similar Demographics by Median Female Earnings
Demographics Similar to Jamaicans by Median Female Earnings
In terms of median female earnings, the demographic groups most similar to Jamaicans are Iraqi ($38,666, a difference of 0.010%), Spaniard ($38,656, a difference of 0.030%), Immigrants from Ecuador ($38,644, a difference of 0.070%), Guamanian/Chamorro ($38,717, a difference of 0.12%), and Immigrants from Jamaica ($38,625, a difference of 0.12%).
| Demographics | Rating | Rank | Median Female Earnings |
| Immigrants | Bosnia and Herzegovina | 15.6 /100 | #206 | Poor $38,886 |
| Immigrants | Cambodia | 14.2 /100 | #207 | Poor $38,833 |
| Immigrants | Thailand | 13.6 /100 | #208 | Poor $38,810 |
| Norwegians | 13.4 /100 | #209 | Poor $38,802 |
| Czechoslovakians | 12.0 /100 | #210 | Poor $38,738 |
| Aleuts | 11.6 /100 | #211 | Poor $38,719 |
| Guamanians/Chamorros | 11.5 /100 | #212 | Poor $38,717 |
| Jamaicans | 10.5 /100 | #213 | Poor $38,670 |
| Iraqis | 10.5 /100 | #214 | Poor $38,666 |
| Spaniards | 10.3 /100 | #215 | Poor $38,656 |
| Immigrants | Ecuador | 10.1 /100 | #216 | Poor $38,644 |
| Immigrants | Jamaica | 9.7 /100 | #217 | Tragic $38,625 |
| Cape Verdeans | 9.5 /100 | #218 | Tragic $38,614 |
| Nepalese | 9.3 /100 | #219 | Tragic $38,603 |
| Yugoslavians | 8.8 /100 | #220 | Tragic $38,573 |
Demographics Similar to Immigrants from Cabo Verde by Median Female Earnings
In terms of median female earnings, the demographic groups most similar to Immigrants from Cabo Verde are Sudanese ($38,215, a difference of 0.020%), Liberian ($38,215, a difference of 0.020%), Alaska Native ($38,202, a difference of 0.020%), English ($38,196, a difference of 0.030%), and Finnish ($38,173, a difference of 0.090%).
| Demographics | Rating | Rank | Median Female Earnings |
| Basques | 5.7 /100 | #230 | Tragic $38,352 |
| Somalis | 5.5 /100 | #231 | Tragic $38,333 |
| Scandinavians | 5.2 /100 | #232 | Tragic $38,306 |
| Tongans | 5.1 /100 | #233 | Tragic $38,288 |
| Celtics | 5.0 /100 | #234 | Tragic $38,283 |
| Sudanese | 4.4 /100 | #235 | Tragic $38,215 |
| Liberians | 4.4 /100 | #236 | Tragic $38,215 |
| Immigrants | Cabo Verde | 4.3 /100 | #237 | Tragic $38,208 |
| Alaska Natives | 4.3 /100 | #238 | Tragic $38,202 |
| English | 4.2 /100 | #239 | Tragic $38,196 |
| Finns | 4.0 /100 | #240 | Tragic $38,173 |
| Spanish | 3.5 /100 | #241 | Tragic $38,098 |
| Immigrants | Burma/Myanmar | 3.0 /100 | #242 | Tragic $38,028 |
| Germans | 2.8 /100 | #243 | Tragic $37,986 |
| Immigrants | Liberia | 2.7 /100 | #244 | Tragic $37,970 |