Colville vs Immigrants from Cabo Verde Median Female Earnings
COMPARE
Colville
Immigrants from Cabo Verde
Median Female Earnings
Median Female Earnings Comparison
Colville
Immigrants from Cabo Verde
$37,514
MEDIAN FEMALE EARNINGS
1.1/ 100
METRIC RATING
255th/ 347
METRIC RANK
$38,208
MEDIAN FEMALE EARNINGS
4.3/ 100
METRIC RATING
237th/ 347
METRIC RANK
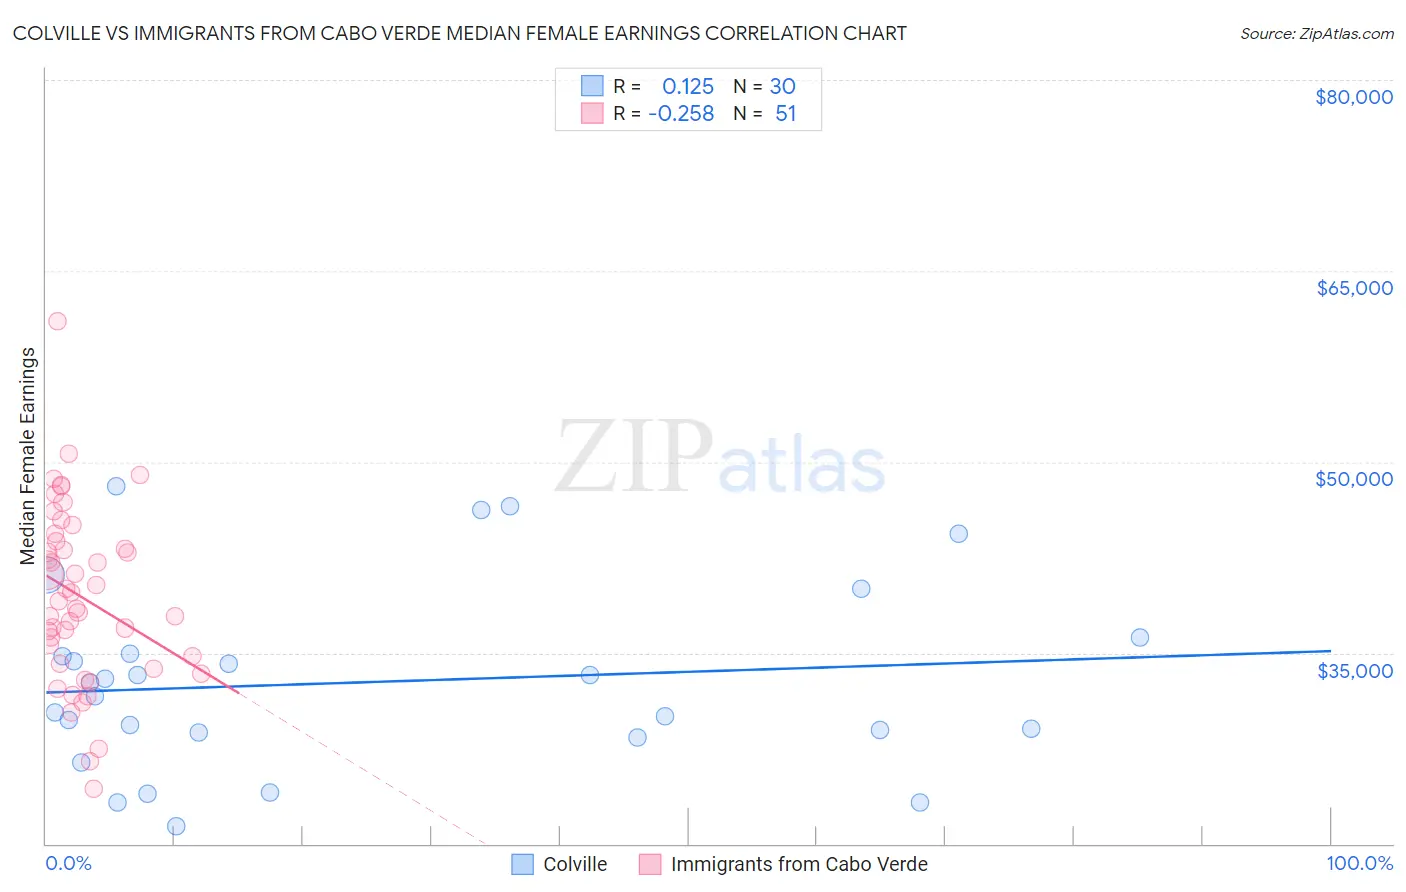
Colville vs Immigrants from Cabo Verde Median Female Earnings Correlation Chart
The statistical analysis conducted on geographies consisting of 34,680,169 people shows a poor positive correlation between the proportion of Colville and median female earnings in the United States with a correlation coefficient (R) of 0.125 and weighted average of $37,514. Similarly, the statistical analysis conducted on geographies consisting of 38,158,316 people shows a weak negative correlation between the proportion of Immigrants from Cabo Verde and median female earnings in the United States with a correlation coefficient (R) of -0.258 and weighted average of $38,208, a difference of 1.8%.
Median Female Earnings Correlation Summary
| Measurement | Colville | Immigrants from Cabo Verde |
| Minimum | $21,333 | $24,340 |
| Maximum | $48,065 | $61,096 |
| Range | $26,732 | $36,756 |
| Mean | $32,694 | $39,427 |
| Median | $32,120 | $39,071 |
| Interquartile 25% (IQ1) | $28,750 | $34,187 |
| Interquartile 75% (IQ3) | $34,898 | $43,779 |
| Interquartile Range (IQR) | $6,148 | $9,592 |
| Standard Deviation (Sample) | $7,179 | $6,953 |
| Standard Deviation (Population) | $7,058 | $6,885 |
Demographics Similar to Colville and Immigrants from Cabo Verde by Median Female Earnings
In terms of median female earnings, the demographic groups most similar to Colville are White/Caucasian ($37,531, a difference of 0.040%), Samoan ($37,498, a difference of 0.040%), Danish ($37,730, a difference of 0.58%), Immigrants from Dominica ($37,825, a difference of 0.83%), and Welsh ($37,856, a difference of 0.91%). Similarly, the demographic groups most similar to Immigrants from Cabo Verde are Liberian ($38,215, a difference of 0.020%), Alaska Native ($38,202, a difference of 0.020%), English ($38,196, a difference of 0.030%), Finnish ($38,173, a difference of 0.090%), and Spanish ($38,098, a difference of 0.29%).
| Demographics | Rating | Rank | Median Female Earnings |
| Liberians | 4.4 /100 | #236 | Tragic $38,215 |
| Immigrants | Cabo Verde | 4.3 /100 | #237 | Tragic $38,208 |
| Alaska Natives | 4.3 /100 | #238 | Tragic $38,202 |
| English | 4.2 /100 | #239 | Tragic $38,196 |
| Finns | 4.0 /100 | #240 | Tragic $38,173 |
| Spanish | 3.5 /100 | #241 | Tragic $38,098 |
| Immigrants | Burma/Myanmar | 3.0 /100 | #242 | Tragic $38,028 |
| Germans | 2.8 /100 | #243 | Tragic $37,986 |
| Immigrants | Liberia | 2.7 /100 | #244 | Tragic $37,970 |
| Immigrants | Middle Africa | 2.7 /100 | #245 | Tragic $37,965 |
| Delaware | 2.6 /100 | #246 | Tragic $37,964 |
| Immigrants | Somalia | 2.4 /100 | #247 | Tragic $37,914 |
| Alaskan Athabascans | 2.3 /100 | #248 | Tragic $37,905 |
| Swiss | 2.3 /100 | #249 | Tragic $37,904 |
| Immigrants | Iraq | 2.2 /100 | #250 | Tragic $37,864 |
| Welsh | 2.1 /100 | #251 | Tragic $37,856 |
| Immigrants | Dominica | 2.0 /100 | #252 | Tragic $37,825 |
| Danes | 1.6 /100 | #253 | Tragic $37,730 |
| Whites/Caucasians | 1.1 /100 | #254 | Tragic $37,531 |
| Colville | 1.1 /100 | #255 | Tragic $37,514 |
| Samoans | 1.0 /100 | #256 | Tragic $37,498 |