German Russian vs Immigrants from Czechoslovakia Median Female Earnings
COMPARE
German Russian
Immigrants from Czechoslovakia
Median Female Earnings
Median Female Earnings Comparison
German Russians
Immigrants from Czechoslovakia
$37,105
MEDIAN FEMALE EARNINGS
0.5/ 100
METRIC RATING
263rd/ 347
METRIC RANK
$43,571
MEDIAN FEMALE EARNINGS
100.0/ 100
METRIC RATING
44th/ 347
METRIC RANK
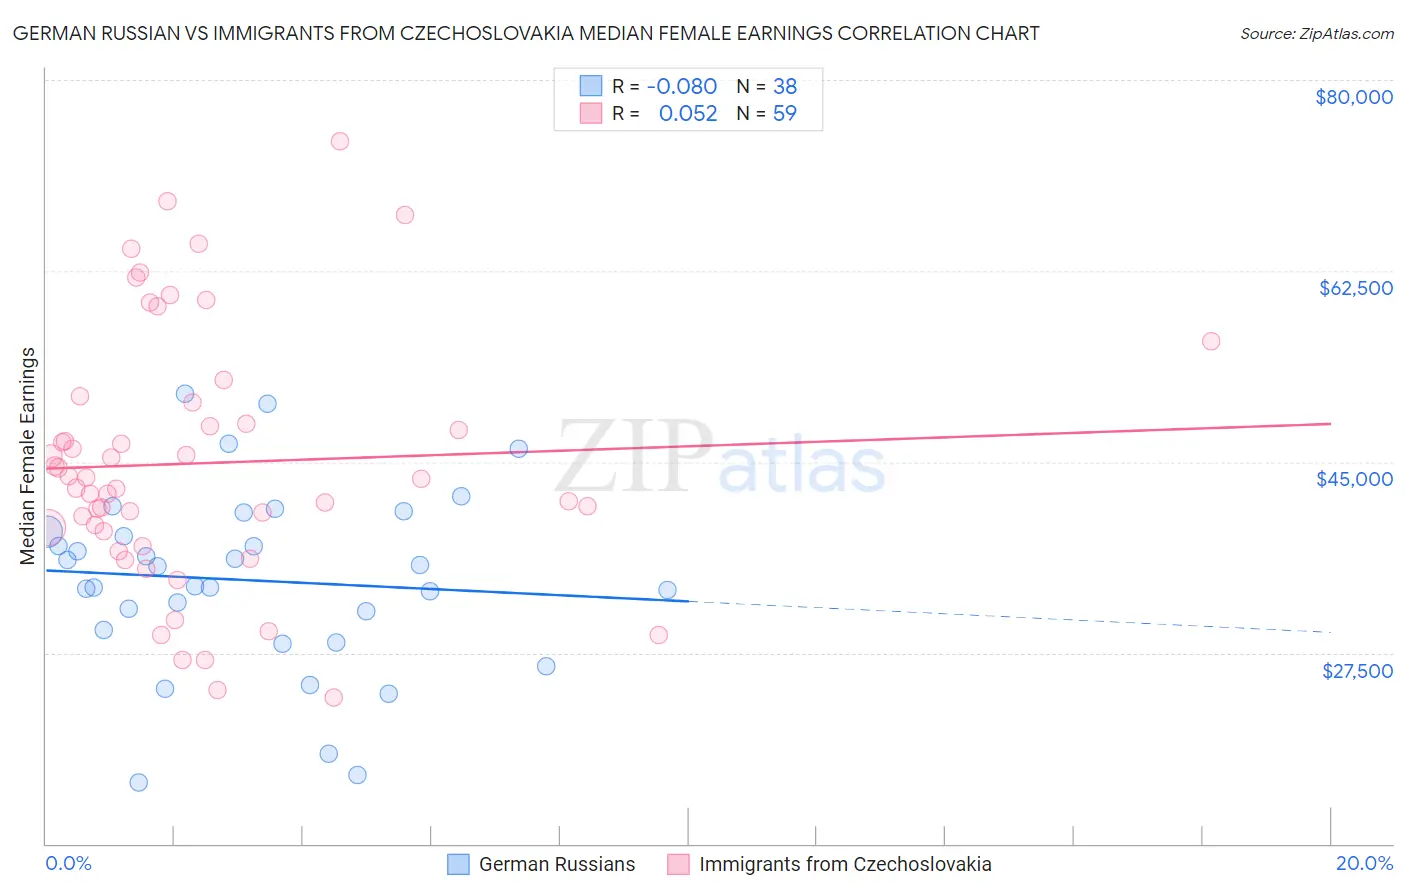
German Russian vs Immigrants from Czechoslovakia Median Female Earnings Correlation Chart
The statistical analysis conducted on geographies consisting of 96,453,013 people shows a slight negative correlation between the proportion of German Russians and median female earnings in the United States with a correlation coefficient (R) of -0.080 and weighted average of $37,105. Similarly, the statistical analysis conducted on geographies consisting of 195,434,199 people shows a slight positive correlation between the proportion of Immigrants from Czechoslovakia and median female earnings in the United States with a correlation coefficient (R) of 0.052 and weighted average of $43,571, a difference of 17.4%.
Median Female Earnings Correlation Summary
| Measurement | German Russian | Immigrants from Czechoslovakia |
| Minimum | $15,652 | $23,424 |
| Maximum | $51,256 | $74,375 |
| Range | $35,604 | $50,951 |
| Mean | $34,138 | $44,894 |
| Median | $34,536 | $43,456 |
| Interquartile 25% (IQ1) | $29,635 | $38,665 |
| Interquartile 75% (IQ3) | $38,614 | $50,450 |
| Interquartile Range (IQR) | $8,979 | $11,786 |
| Standard Deviation (Sample) | $8,300 | $11,575 |
| Standard Deviation (Population) | $8,190 | $11,476 |
Similar Demographics by Median Female Earnings
Demographics Similar to German Russians by Median Female Earnings
In terms of median female earnings, the demographic groups most similar to German Russians are Salvadoran ($37,083, a difference of 0.060%), Immigrants from Belize ($37,056, a difference of 0.13%), Dominican ($37,046, a difference of 0.16%), Nonimmigrants ($37,024, a difference of 0.22%), and Cree ($37,018, a difference of 0.24%).
| Demographics | Rating | Rank | Median Female Earnings |
| Samoans | 1.0 /100 | #256 | Tragic $37,498 |
| Hawaiians | 1.0 /100 | #257 | Tragic $37,497 |
| Belizeans | 0.9 /100 | #258 | Tragic $37,429 |
| Scotch-Irish | 0.8 /100 | #259 | Tragic $37,383 |
| Dutch | 0.7 /100 | #260 | Tragic $37,339 |
| Malaysians | 0.7 /100 | #261 | Tragic $37,298 |
| Venezuelans | 0.7 /100 | #262 | Tragic $37,282 |
| German Russians | 0.5 /100 | #263 | Tragic $37,105 |
| Salvadorans | 0.4 /100 | #264 | Tragic $37,083 |
| Immigrants | Belize | 0.4 /100 | #265 | Tragic $37,056 |
| Dominicans | 0.4 /100 | #266 | Tragic $37,046 |
| Immigrants | Nonimmigrants | 0.4 /100 | #267 | Tragic $37,024 |
| Cree | 0.4 /100 | #268 | Tragic $37,018 |
| Immigrants | Venezuela | 0.4 /100 | #269 | Tragic $37,003 |
| French American Indians | 0.3 /100 | #270 | Tragic $36,920 |
Demographics Similar to Immigrants from Czechoslovakia by Median Female Earnings
In terms of median female earnings, the demographic groups most similar to Immigrants from Czechoslovakia are Immigrants from Europe ($43,523, a difference of 0.11%), Bulgarian ($43,638, a difference of 0.15%), Immigrants from Denmark ($43,646, a difference of 0.17%), Bhutanese ($43,648, a difference of 0.18%), and Immigrants from Bolivia ($43,467, a difference of 0.24%).
| Demographics | Rating | Rank | Median Female Earnings |
| Immigrants | Switzerland | 100.0 /100 | #37 | Exceptional $43,996 |
| Latvians | 100.0 /100 | #38 | Exceptional $43,941 |
| Israelis | 100.0 /100 | #39 | Exceptional $43,852 |
| Immigrants | Malaysia | 100.0 /100 | #40 | Exceptional $43,835 |
| Bhutanese | 100.0 /100 | #41 | Exceptional $43,648 |
| Immigrants | Denmark | 100.0 /100 | #42 | Exceptional $43,646 |
| Bulgarians | 100.0 /100 | #43 | Exceptional $43,638 |
| Immigrants | Czechoslovakia | 100.0 /100 | #44 | Exceptional $43,571 |
| Immigrants | Europe | 100.0 /100 | #45 | Exceptional $43,523 |
| Immigrants | Bolivia | 100.0 /100 | #46 | Exceptional $43,467 |
| Bolivians | 100.0 /100 | #47 | Exceptional $43,445 |
| Immigrants | Indonesia | 100.0 /100 | #48 | Exceptional $43,412 |
| Immigrants | Serbia | 100.0 /100 | #49 | Exceptional $43,385 |
| Immigrants | Uzbekistan | 100.0 /100 | #50 | Exceptional $43,363 |
| Maltese | 100.0 /100 | #51 | Exceptional $43,357 |