Immigrants from Denmark vs Immigrants from Czechoslovakia Median Female Earnings
COMPARE
Immigrants from Denmark
Immigrants from Czechoslovakia
Median Female Earnings
Median Female Earnings Comparison
Immigrants from Denmark
Immigrants from Czechoslovakia
$43,646
MEDIAN FEMALE EARNINGS
100.0/ 100
METRIC RATING
42nd/ 347
METRIC RANK
$43,571
MEDIAN FEMALE EARNINGS
100.0/ 100
METRIC RATING
44th/ 347
METRIC RANK
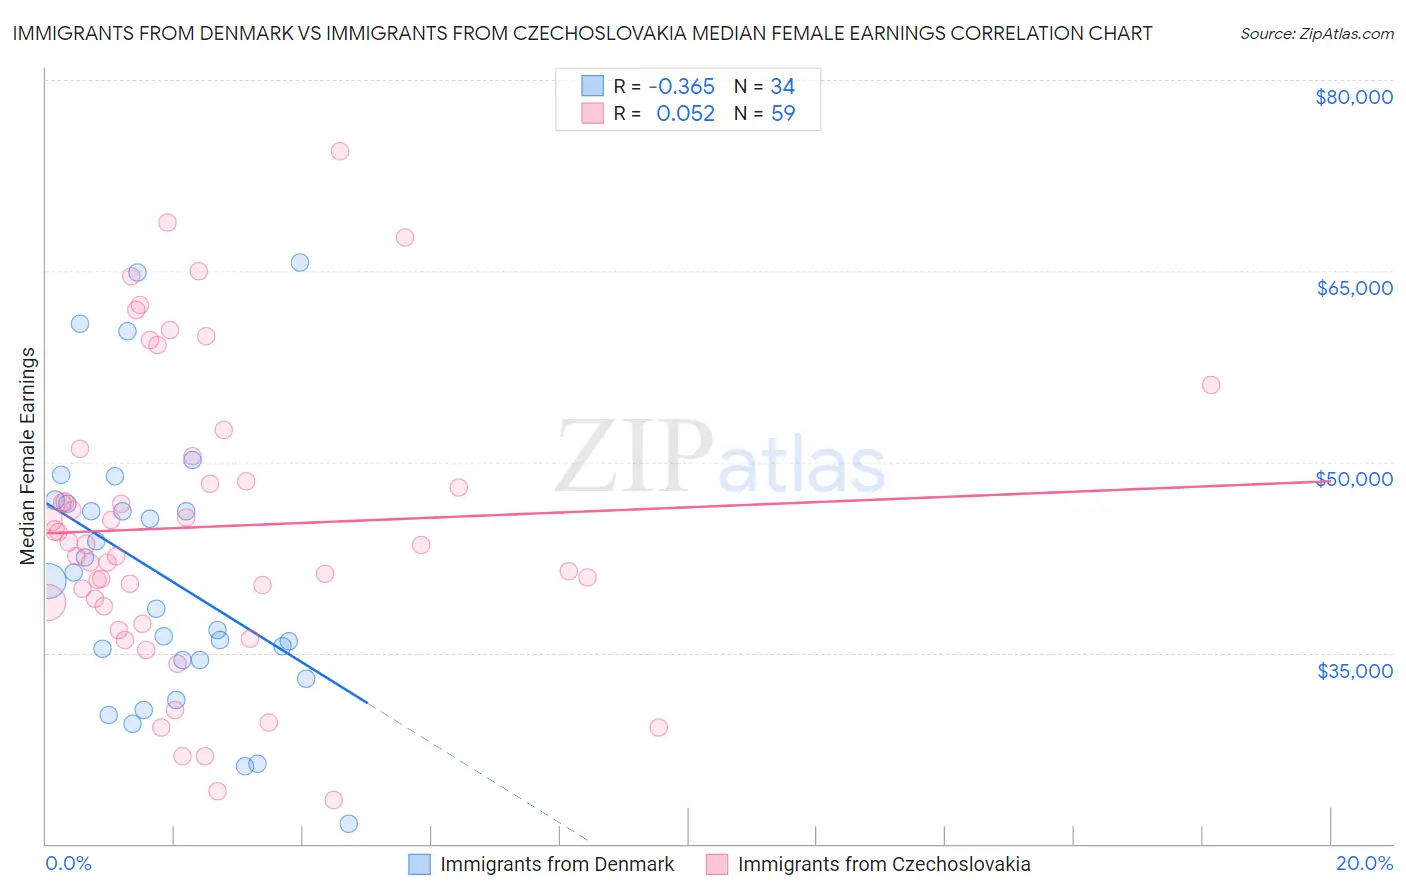
Immigrants from Denmark vs Immigrants from Czechoslovakia Median Female Earnings Correlation Chart
The statistical analysis conducted on geographies consisting of 136,407,509 people shows a mild negative correlation between the proportion of Immigrants from Denmark and median female earnings in the United States with a correlation coefficient (R) of -0.365 and weighted average of $43,646. Similarly, the statistical analysis conducted on geographies consisting of 195,434,199 people shows a slight positive correlation between the proportion of Immigrants from Czechoslovakia and median female earnings in the United States with a correlation coefficient (R) of 0.052 and weighted average of $43,571, a difference of 0.17%.
Median Female Earnings Correlation Summary
| Measurement | Immigrants from Denmark | Immigrants from Czechoslovakia |
| Minimum | $21,591 | $23,424 |
| Maximum | $65,662 | $74,375 |
| Range | $44,071 | $50,951 |
| Mean | $41,084 | $44,894 |
| Median | $39,517 | $43,456 |
| Interquartile 25% (IQ1) | $34,414 | $38,665 |
| Interquartile 75% (IQ3) | $46,746 | $50,450 |
| Interquartile Range (IQR) | $12,332 | $11,786 |
| Standard Deviation (Sample) | $10,895 | $11,575 |
| Standard Deviation (Population) | $10,734 | $11,476 |
Demographics Similar to Immigrants from Denmark and Immigrants from Czechoslovakia by Median Female Earnings
In terms of median female earnings, the demographic groups most similar to Immigrants from Denmark are Bhutanese ($43,648, a difference of 0.0%), Bulgarian ($43,638, a difference of 0.020%), Immigrants from Europe ($43,523, a difference of 0.28%), Immigrants from Bolivia ($43,467, a difference of 0.41%), and Immigrants from Malaysia ($43,835, a difference of 0.43%). Similarly, the demographic groups most similar to Immigrants from Czechoslovakia are Immigrants from Europe ($43,523, a difference of 0.11%), Bulgarian ($43,638, a difference of 0.15%), Bhutanese ($43,648, a difference of 0.18%), Immigrants from Bolivia ($43,467, a difference of 0.24%), and Bolivian ($43,445, a difference of 0.29%).
| Demographics | Rating | Rank | Median Female Earnings |
| Immigrants | Asia | 100.0 /100 | #33 | Exceptional $44,198 |
| Russians | 100.0 /100 | #34 | Exceptional $44,169 |
| Immigrants | Sri Lanka | 100.0 /100 | #35 | Exceptional $44,161 |
| Immigrants | Turkey | 100.0 /100 | #36 | Exceptional $44,066 |
| Immigrants | Switzerland | 100.0 /100 | #37 | Exceptional $43,996 |
| Latvians | 100.0 /100 | #38 | Exceptional $43,941 |
| Israelis | 100.0 /100 | #39 | Exceptional $43,852 |
| Immigrants | Malaysia | 100.0 /100 | #40 | Exceptional $43,835 |
| Bhutanese | 100.0 /100 | #41 | Exceptional $43,648 |
| Immigrants | Denmark | 100.0 /100 | #42 | Exceptional $43,646 |
| Bulgarians | 100.0 /100 | #43 | Exceptional $43,638 |
| Immigrants | Czechoslovakia | 100.0 /100 | #44 | Exceptional $43,571 |
| Immigrants | Europe | 100.0 /100 | #45 | Exceptional $43,523 |
| Immigrants | Bolivia | 100.0 /100 | #46 | Exceptional $43,467 |
| Bolivians | 100.0 /100 | #47 | Exceptional $43,445 |
| Immigrants | Indonesia | 100.0 /100 | #48 | Exceptional $43,412 |
| Immigrants | Serbia | 100.0 /100 | #49 | Exceptional $43,385 |
| Immigrants | Uzbekistan | 100.0 /100 | #50 | Exceptional $43,363 |
| Maltese | 100.0 /100 | #51 | Exceptional $43,357 |
| Immigrants | Lithuania | 99.9 /100 | #52 | Exceptional $43,317 |
| Immigrants | Eastern Europe | 99.9 /100 | #53 | Exceptional $43,309 |