Immigrants from Hong Kong vs Immigrants from Czechoslovakia Median Female Earnings
COMPARE
Immigrants from Hong Kong
Immigrants from Czechoslovakia
Median Female Earnings
Median Female Earnings Comparison
Immigrants from Hong Kong
Immigrants from Czechoslovakia
$49,818
MEDIAN FEMALE EARNINGS
100.0/ 100
METRIC RATING
1st/ 347
METRIC RANK
$43,571
MEDIAN FEMALE EARNINGS
100.0/ 100
METRIC RATING
44th/ 347
METRIC RANK
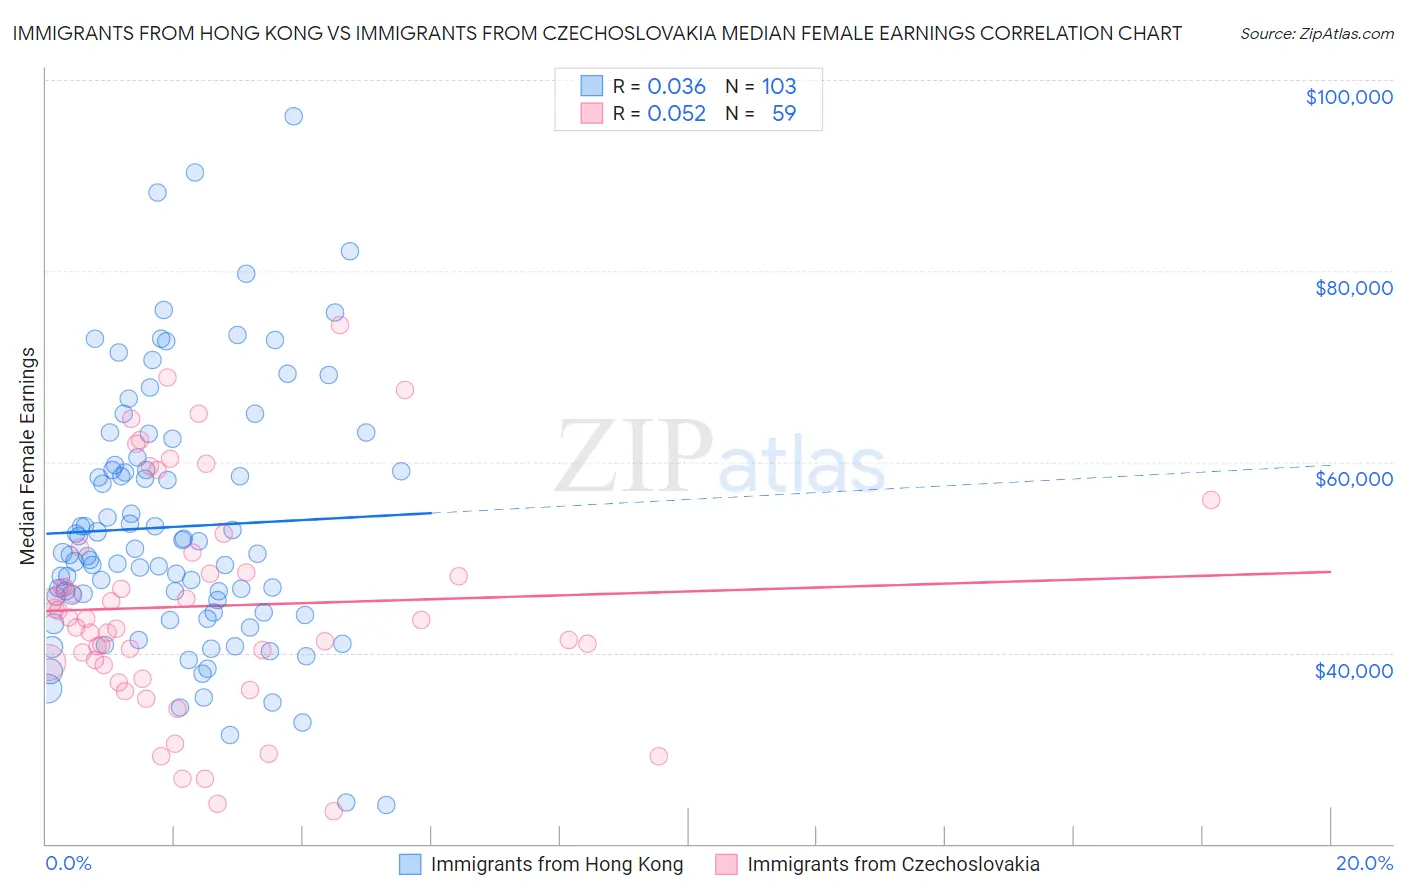
Immigrants from Hong Kong vs Immigrants from Czechoslovakia Median Female Earnings Correlation Chart
The statistical analysis conducted on geographies consisting of 253,932,744 people shows no correlation between the proportion of Immigrants from Hong Kong and median female earnings in the United States with a correlation coefficient (R) of 0.036 and weighted average of $49,818. Similarly, the statistical analysis conducted on geographies consisting of 195,434,199 people shows a slight positive correlation between the proportion of Immigrants from Czechoslovakia and median female earnings in the United States with a correlation coefficient (R) of 0.052 and weighted average of $43,571, a difference of 14.3%.
Median Female Earnings Correlation Summary
| Measurement | Immigrants from Hong Kong | Immigrants from Czechoslovakia |
| Minimum | $24,038 | $23,424 |
| Maximum | $96,250 | $74,375 |
| Range | $72,212 | $50,951 |
| Mean | $53,195 | $44,894 |
| Median | $50,354 | $43,456 |
| Interquartile 25% (IQ1) | $44,209 | $38,665 |
| Interquartile 75% (IQ3) | $59,618 | $50,450 |
| Interquartile Range (IQR) | $15,409 | $11,786 |
| Standard Deviation (Sample) | $13,646 | $11,575 |
| Standard Deviation (Population) | $13,580 | $11,476 |
Similar Demographics by Median Female Earnings
Demographics Similar to Immigrants from Hong Kong by Median Female Earnings
In terms of median female earnings, the demographic groups most similar to Immigrants from Hong Kong are Filipino ($49,508, a difference of 0.63%), Immigrants from Taiwan ($49,256, a difference of 1.1%), Immigrants from India ($48,292, a difference of 3.2%), Immigrants from Singapore ($47,986, a difference of 3.8%), and Immigrants from Ireland ($47,598, a difference of 4.7%).
| Demographics | Rating | Rank | Median Female Earnings |
| Immigrants | Hong Kong | 100.0 /100 | #1 | Exceptional $49,818 |
| Filipinos | 100.0 /100 | #2 | Exceptional $49,508 |
| Immigrants | Taiwan | 100.0 /100 | #3 | Exceptional $49,256 |
| Immigrants | India | 100.0 /100 | #4 | Exceptional $48,292 |
| Immigrants | Singapore | 100.0 /100 | #5 | Exceptional $47,986 |
| Immigrants | Ireland | 100.0 /100 | #6 | Exceptional $47,598 |
| Thais | 100.0 /100 | #7 | Exceptional $47,577 |
| Iranians | 100.0 /100 | #8 | Exceptional $47,421 |
| Immigrants | Iran | 100.0 /100 | #9 | Exceptional $47,154 |
| Immigrants | China | 100.0 /100 | #10 | Exceptional $46,972 |
| Okinawans | 100.0 /100 | #11 | Exceptional $46,905 |
| Immigrants | Israel | 100.0 /100 | #12 | Exceptional $46,902 |
| Immigrants | Australia | 100.0 /100 | #13 | Exceptional $46,573 |
| Soviet Union | 100.0 /100 | #14 | Exceptional $46,556 |
| Immigrants | Eastern Asia | 100.0 /100 | #15 | Exceptional $46,502 |
Demographics Similar to Immigrants from Czechoslovakia by Median Female Earnings
In terms of median female earnings, the demographic groups most similar to Immigrants from Czechoslovakia are Immigrants from Europe ($43,523, a difference of 0.11%), Bulgarian ($43,638, a difference of 0.15%), Immigrants from Denmark ($43,646, a difference of 0.17%), Bhutanese ($43,648, a difference of 0.18%), and Immigrants from Bolivia ($43,467, a difference of 0.24%).
| Demographics | Rating | Rank | Median Female Earnings |
| Immigrants | Switzerland | 100.0 /100 | #37 | Exceptional $43,996 |
| Latvians | 100.0 /100 | #38 | Exceptional $43,941 |
| Israelis | 100.0 /100 | #39 | Exceptional $43,852 |
| Immigrants | Malaysia | 100.0 /100 | #40 | Exceptional $43,835 |
| Bhutanese | 100.0 /100 | #41 | Exceptional $43,648 |
| Immigrants | Denmark | 100.0 /100 | #42 | Exceptional $43,646 |
| Bulgarians | 100.0 /100 | #43 | Exceptional $43,638 |
| Immigrants | Czechoslovakia | 100.0 /100 | #44 | Exceptional $43,571 |
| Immigrants | Europe | 100.0 /100 | #45 | Exceptional $43,523 |
| Immigrants | Bolivia | 100.0 /100 | #46 | Exceptional $43,467 |
| Bolivians | 100.0 /100 | #47 | Exceptional $43,445 |
| Immigrants | Indonesia | 100.0 /100 | #48 | Exceptional $43,412 |
| Immigrants | Serbia | 100.0 /100 | #49 | Exceptional $43,385 |
| Immigrants | Uzbekistan | 100.0 /100 | #50 | Exceptional $43,363 |
| Maltese | 100.0 /100 | #51 | Exceptional $43,357 |