Immigrants from Cuba vs Immigrants from Belize Median Female Earnings
COMPARE
Immigrants from Cuba
Immigrants from Belize
Median Female Earnings
Median Female Earnings Comparison
Immigrants from Cuba
Immigrants from Belize
$33,291
MEDIAN FEMALE EARNINGS
0.0/ 100
METRIC RATING
338th/ 347
METRIC RANK
$37,056
MEDIAN FEMALE EARNINGS
0.4/ 100
METRIC RATING
265th/ 347
METRIC RANK
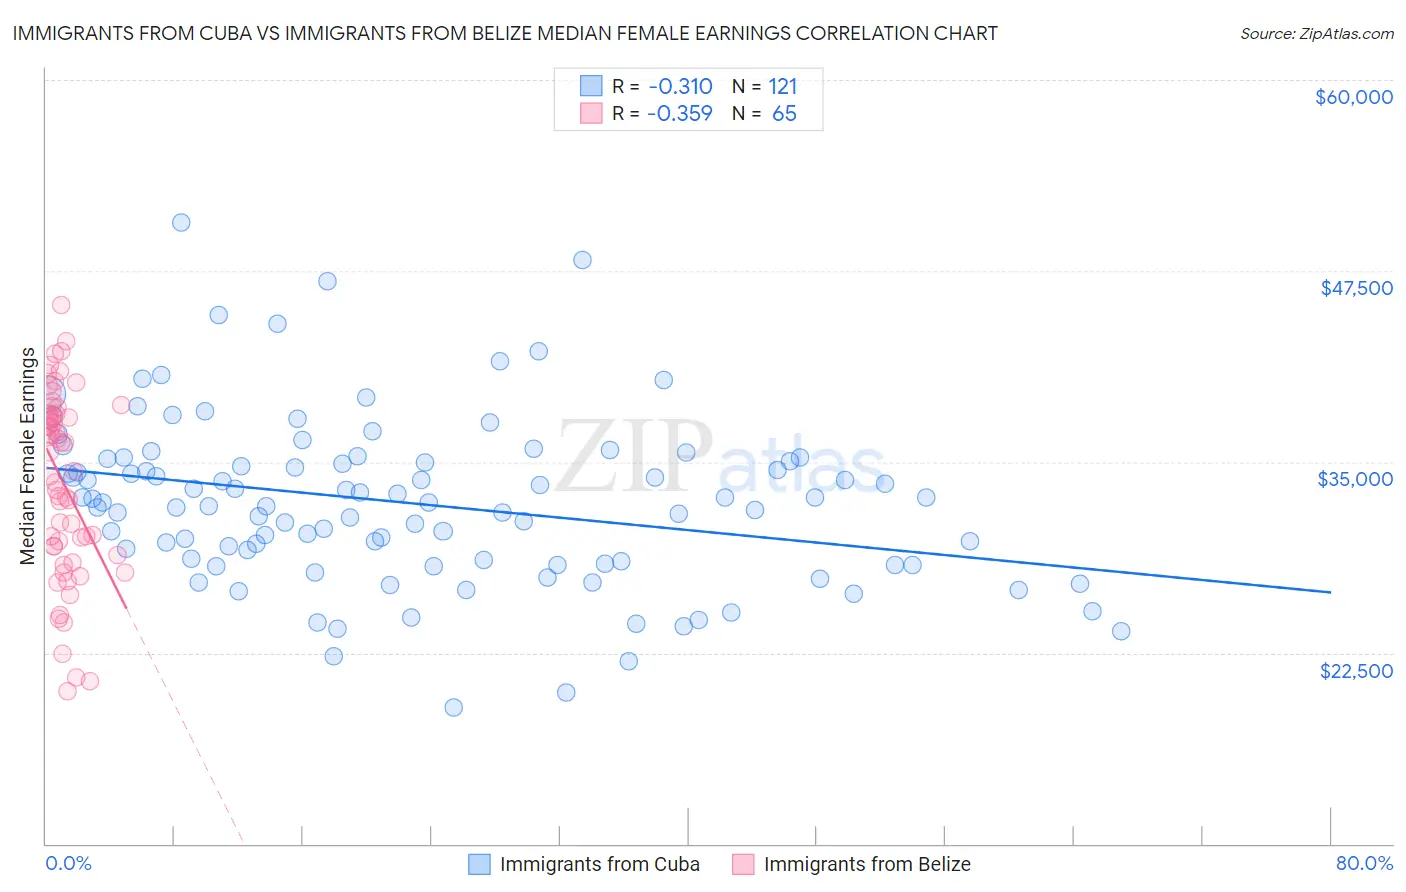
Immigrants from Cuba vs Immigrants from Belize Median Female Earnings Correlation Chart
The statistical analysis conducted on geographies consisting of 325,881,101 people shows a mild negative correlation between the proportion of Immigrants from Cuba and median female earnings in the United States with a correlation coefficient (R) of -0.310 and weighted average of $33,291. Similarly, the statistical analysis conducted on geographies consisting of 130,285,587 people shows a mild negative correlation between the proportion of Immigrants from Belize and median female earnings in the United States with a correlation coefficient (R) of -0.359 and weighted average of $37,056, a difference of 11.3%.
Median Female Earnings Correlation Summary
| Measurement | Immigrants from Cuba | Immigrants from Belize |
| Minimum | $18,945 | $19,964 |
| Maximum | $50,658 | $45,241 |
| Range | $31,713 | $25,277 |
| Mean | $32,289 | $33,651 |
| Median | $32,306 | $34,358 |
| Interquartile 25% (IQ1) | $28,389 | $29,185 |
| Interquartile 75% (IQ3) | $35,158 | $38,173 |
| Interquartile Range (IQR) | $6,769 | $8,989 |
| Standard Deviation (Sample) | $5,505 | $6,058 |
| Standard Deviation (Population) | $5,482 | $6,012 |
Similar Demographics by Median Female Earnings
Demographics Similar to Immigrants from Cuba by Median Female Earnings
In terms of median female earnings, the demographic groups most similar to Immigrants from Cuba are Immigrants from Mexico ($33,236, a difference of 0.17%), Yakama ($33,354, a difference of 0.19%), Ottawa ($33,378, a difference of 0.26%), Tohono O'odham ($33,205, a difference of 0.26%), and Creek ($33,437, a difference of 0.44%).
| Demographics | Rating | Rank | Median Female Earnings |
| Natives/Alaskans | 0.0 /100 | #331 | Tragic $33,806 |
| Choctaw | 0.0 /100 | #332 | Tragic $33,775 |
| Mexicans | 0.0 /100 | #333 | Tragic $33,664 |
| Spanish American Indians | 0.0 /100 | #334 | Tragic $33,625 |
| Creek | 0.0 /100 | #335 | Tragic $33,437 |
| Ottawa | 0.0 /100 | #336 | Tragic $33,378 |
| Yakama | 0.0 /100 | #337 | Tragic $33,354 |
| Immigrants | Cuba | 0.0 /100 | #338 | Tragic $33,291 |
| Immigrants | Mexico | 0.0 /100 | #339 | Tragic $33,236 |
| Tohono O'odham | 0.0 /100 | #340 | Tragic $33,205 |
| Navajo | 0.0 /100 | #341 | Tragic $33,046 |
| Yup'ik | 0.0 /100 | #342 | Tragic $32,730 |
| Pueblo | 0.0 /100 | #343 | Tragic $32,564 |
| Lumbee | 0.0 /100 | #344 | Tragic $32,500 |
| Puerto Ricans | 0.0 /100 | #345 | Tragic $31,560 |
Demographics Similar to Immigrants from Belize by Median Female Earnings
In terms of median female earnings, the demographic groups most similar to Immigrants from Belize are Dominican ($37,046, a difference of 0.030%), Salvadoran ($37,083, a difference of 0.070%), Nonimmigrants ($37,024, a difference of 0.090%), Cree ($37,018, a difference of 0.10%), and German Russian ($37,105, a difference of 0.13%).
| Demographics | Rating | Rank | Median Female Earnings |
| Belizeans | 0.9 /100 | #258 | Tragic $37,429 |
| Scotch-Irish | 0.8 /100 | #259 | Tragic $37,383 |
| Dutch | 0.7 /100 | #260 | Tragic $37,339 |
| Malaysians | 0.7 /100 | #261 | Tragic $37,298 |
| Venezuelans | 0.7 /100 | #262 | Tragic $37,282 |
| German Russians | 0.5 /100 | #263 | Tragic $37,105 |
| Salvadorans | 0.4 /100 | #264 | Tragic $37,083 |
| Immigrants | Belize | 0.4 /100 | #265 | Tragic $37,056 |
| Dominicans | 0.4 /100 | #266 | Tragic $37,046 |
| Immigrants | Nonimmigrants | 0.4 /100 | #267 | Tragic $37,024 |
| Cree | 0.4 /100 | #268 | Tragic $37,018 |
| Immigrants | Venezuela | 0.4 /100 | #269 | Tragic $37,003 |
| French American Indians | 0.3 /100 | #270 | Tragic $36,920 |
| Nicaraguans | 0.3 /100 | #271 | Tragic $36,904 |
| Immigrants | Dominican Republic | 0.3 /100 | #272 | Tragic $36,857 |