Irish vs Immigrants from Belize Median Female Earnings
COMPARE
Irish
Immigrants from Belize
Median Female Earnings
Median Female Earnings Comparison
Irish
Immigrants from Belize
$39,291
MEDIAN FEMALE EARNINGS
30.0/ 100
METRIC RATING
194th/ 347
METRIC RANK
$37,056
MEDIAN FEMALE EARNINGS
0.4/ 100
METRIC RATING
265th/ 347
METRIC RANK
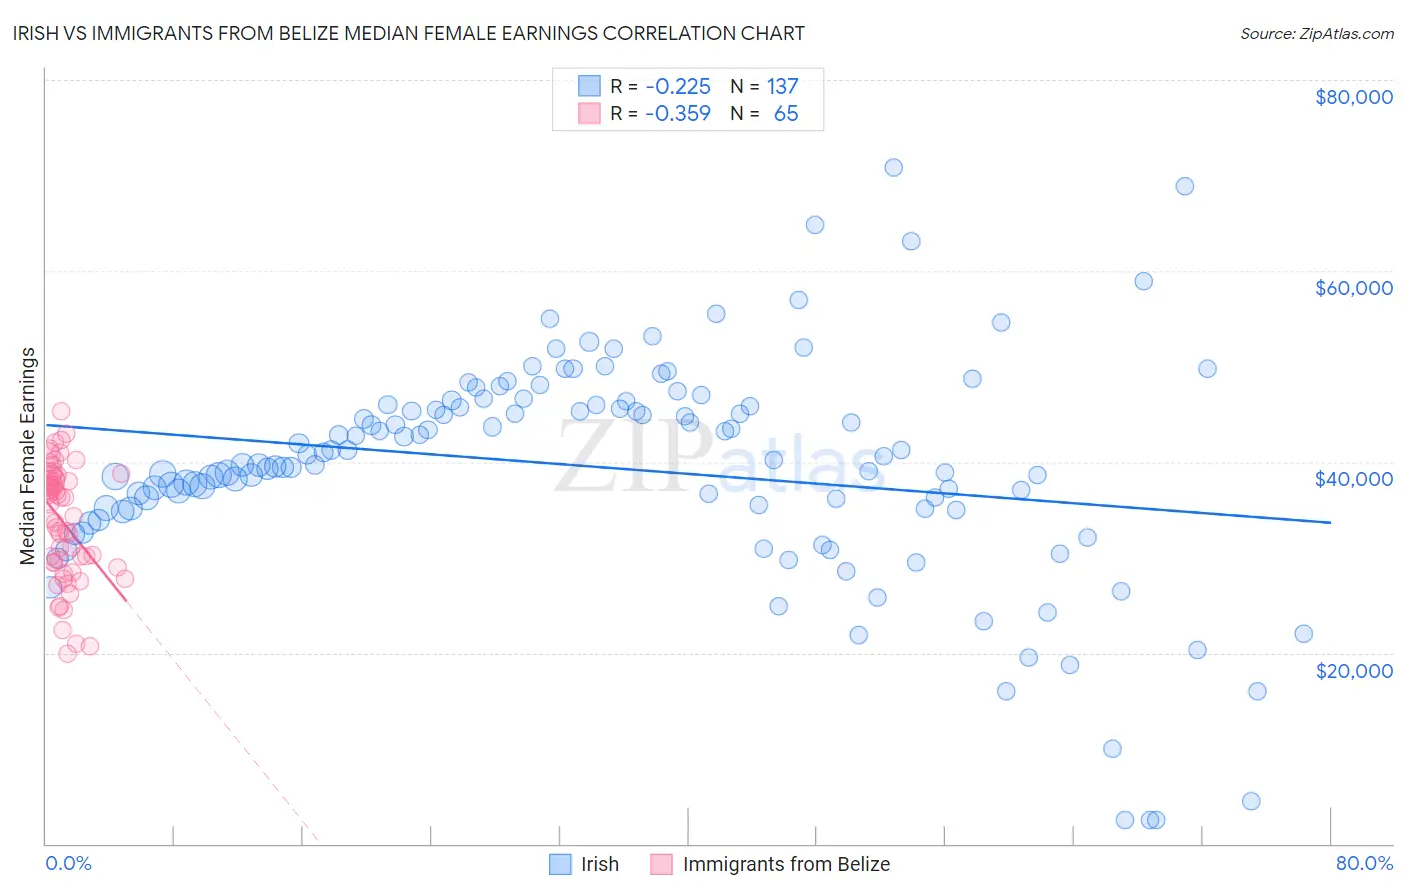
Irish vs Immigrants from Belize Median Female Earnings Correlation Chart
The statistical analysis conducted on geographies consisting of 577,855,613 people shows a weak negative correlation between the proportion of Irish and median female earnings in the United States with a correlation coefficient (R) of -0.225 and weighted average of $39,291. Similarly, the statistical analysis conducted on geographies consisting of 130,285,587 people shows a mild negative correlation between the proportion of Immigrants from Belize and median female earnings in the United States with a correlation coefficient (R) of -0.359 and weighted average of $37,056, a difference of 6.0%.
Median Female Earnings Correlation Summary
| Measurement | Irish | Immigrants from Belize |
| Minimum | $2,499 | $19,964 |
| Maximum | $70,827 | $45,241 |
| Range | $68,328 | $25,277 |
| Mean | $39,404 | $33,651 |
| Median | $40,229 | $34,358 |
| Interquartile 25% (IQ1) | $35,070 | $29,185 |
| Interquartile 75% (IQ3) | $45,938 | $38,173 |
| Interquartile Range (IQR) | $10,868 | $8,989 |
| Standard Deviation (Sample) | $11,843 | $6,058 |
| Standard Deviation (Population) | $11,799 | $6,012 |
Similar Demographics by Median Female Earnings
Demographics Similar to Irish by Median Female Earnings
In terms of median female earnings, the demographic groups most similar to Irish are Immigrants from Nigeria ($39,294, a difference of 0.010%), Immigrants ($39,328, a difference of 0.090%), Immigrants from Western Africa ($39,351, a difference of 0.15%), Uruguayan ($39,228, a difference of 0.16%), and Puget Sound Salish ($39,376, a difference of 0.22%).
| Demographics | Rating | Rank | Median Female Earnings |
| Swedes | 36.0 /100 | #187 | Fair $39,421 |
| Bermudans | 35.9 /100 | #188 | Fair $39,418 |
| Senegalese | 34.2 /100 | #189 | Fair $39,384 |
| Puget Sound Salish | 33.9 /100 | #190 | Fair $39,376 |
| Immigrants | Western Africa | 32.7 /100 | #191 | Fair $39,351 |
| Immigrants | Immigrants | 31.7 /100 | #192 | Fair $39,328 |
| Immigrants | Nigeria | 30.2 /100 | #193 | Fair $39,294 |
| Irish | 30.0 /100 | #194 | Fair $39,291 |
| Uruguayans | 27.3 /100 | #195 | Fair $39,228 |
| Immigrants | Costa Rica | 25.6 /100 | #196 | Fair $39,186 |
| Assyrians/Chaldeans/Syriacs | 24.6 /100 | #197 | Fair $39,159 |
| Ecuadorians | 23.0 /100 | #198 | Fair $39,117 |
| Icelanders | 22.7 /100 | #199 | Fair $39,109 |
| Immigrants | Panama | 20.6 /100 | #200 | Fair $39,049 |
| Panamanians | 20.6 /100 | #201 | Fair $39,049 |
Demographics Similar to Immigrants from Belize by Median Female Earnings
In terms of median female earnings, the demographic groups most similar to Immigrants from Belize are Dominican ($37,046, a difference of 0.030%), Salvadoran ($37,083, a difference of 0.070%), Nonimmigrants ($37,024, a difference of 0.090%), Cree ($37,018, a difference of 0.10%), and German Russian ($37,105, a difference of 0.13%).
| Demographics | Rating | Rank | Median Female Earnings |
| Belizeans | 0.9 /100 | #258 | Tragic $37,429 |
| Scotch-Irish | 0.8 /100 | #259 | Tragic $37,383 |
| Dutch | 0.7 /100 | #260 | Tragic $37,339 |
| Malaysians | 0.7 /100 | #261 | Tragic $37,298 |
| Venezuelans | 0.7 /100 | #262 | Tragic $37,282 |
| German Russians | 0.5 /100 | #263 | Tragic $37,105 |
| Salvadorans | 0.4 /100 | #264 | Tragic $37,083 |
| Immigrants | Belize | 0.4 /100 | #265 | Tragic $37,056 |
| Dominicans | 0.4 /100 | #266 | Tragic $37,046 |
| Immigrants | Nonimmigrants | 0.4 /100 | #267 | Tragic $37,024 |
| Cree | 0.4 /100 | #268 | Tragic $37,018 |
| Immigrants | Venezuela | 0.4 /100 | #269 | Tragic $37,003 |
| French American Indians | 0.3 /100 | #270 | Tragic $36,920 |
| Nicaraguans | 0.3 /100 | #271 | Tragic $36,904 |
| Immigrants | Dominican Republic | 0.3 /100 | #272 | Tragic $36,857 |