Croatian vs Immigrants from Belize Median Female Earnings
COMPARE
Croatian
Immigrants from Belize
Median Female Earnings
Median Female Earnings Comparison
Croatians
Immigrants from Belize
$40,993
MEDIAN FEMALE EARNINGS
93.7/ 100
METRIC RATING
121st/ 347
METRIC RANK
$37,056
MEDIAN FEMALE EARNINGS
0.4/ 100
METRIC RATING
265th/ 347
METRIC RANK
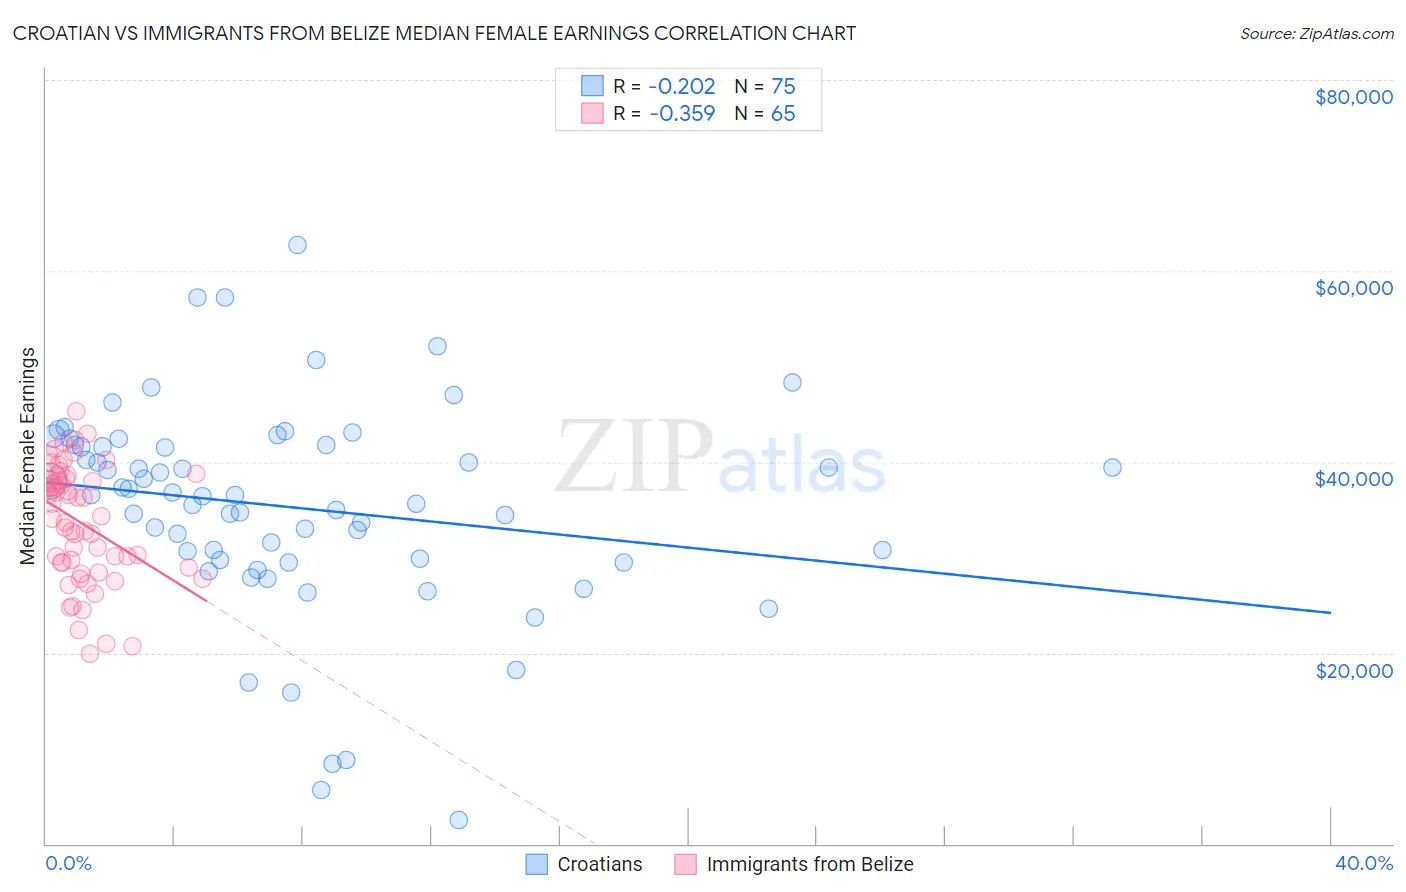
Croatian vs Immigrants from Belize Median Female Earnings Correlation Chart
The statistical analysis conducted on geographies consisting of 375,526,818 people shows a weak negative correlation between the proportion of Croatians and median female earnings in the United States with a correlation coefficient (R) of -0.202 and weighted average of $40,993. Similarly, the statistical analysis conducted on geographies consisting of 130,285,587 people shows a mild negative correlation between the proportion of Immigrants from Belize and median female earnings in the United States with a correlation coefficient (R) of -0.359 and weighted average of $37,056, a difference of 10.6%.
Median Female Earnings Correlation Summary
| Measurement | Croatian | Immigrants from Belize |
| Minimum | $2,499 | $19,964 |
| Maximum | $62,750 | $45,241 |
| Range | $60,251 | $25,277 |
| Mean | $35,223 | $33,651 |
| Median | $36,468 | $34,358 |
| Interquartile 25% (IQ1) | $29,748 | $29,185 |
| Interquartile 75% (IQ3) | $41,743 | $38,173 |
| Interquartile Range (IQR) | $11,995 | $8,989 |
| Standard Deviation (Sample) | $11,020 | $6,058 |
| Standard Deviation (Population) | $10,947 | $6,012 |
Similar Demographics by Median Female Earnings
Demographics Similar to Croatians by Median Female Earnings
In terms of median female earnings, the demographic groups most similar to Croatians are Immigrants from Jordan ($40,977, a difference of 0.040%), Guyanese ($40,973, a difference of 0.050%), Trinidadian and Tobagonian ($40,958, a difference of 0.090%), Immigrants from Kuwait ($41,055, a difference of 0.15%), and Austrian ($40,923, a difference of 0.17%).
| Demographics | Rating | Rank | Median Female Earnings |
| Immigrants | England | 96.4 /100 | #114 | Exceptional $41,277 |
| Koreans | 96.4 /100 | #115 | Exceptional $41,276 |
| Immigrants | Brazil | 96.4 /100 | #116 | Exceptional $41,273 |
| Barbadians | 96.3 /100 | #117 | Exceptional $41,261 |
| Immigrants | Lebanon | 95.6 /100 | #118 | Exceptional $41,183 |
| Immigrants | Philippines | 95.0 /100 | #119 | Exceptional $41,114 |
| Immigrants | Kuwait | 94.4 /100 | #120 | Exceptional $41,055 |
| Croatians | 93.7 /100 | #121 | Exceptional $40,993 |
| Immigrants | Jordan | 93.5 /100 | #122 | Exceptional $40,977 |
| Guyanese | 93.4 /100 | #123 | Exceptional $40,973 |
| Trinidadians and Tobagonians | 93.2 /100 | #124 | Exceptional $40,958 |
| Austrians | 92.7 /100 | #125 | Exceptional $40,923 |
| Immigrants | Trinidad and Tobago | 92.3 /100 | #126 | Exceptional $40,895 |
| Ugandans | 92.2 /100 | #127 | Exceptional $40,889 |
| Carpatho Rusyns | 91.2 /100 | #128 | Exceptional $40,825 |
Demographics Similar to Immigrants from Belize by Median Female Earnings
In terms of median female earnings, the demographic groups most similar to Immigrants from Belize are Dominican ($37,046, a difference of 0.030%), Salvadoran ($37,083, a difference of 0.070%), Nonimmigrants ($37,024, a difference of 0.090%), Cree ($37,018, a difference of 0.10%), and German Russian ($37,105, a difference of 0.13%).
| Demographics | Rating | Rank | Median Female Earnings |
| Belizeans | 0.9 /100 | #258 | Tragic $37,429 |
| Scotch-Irish | 0.8 /100 | #259 | Tragic $37,383 |
| Dutch | 0.7 /100 | #260 | Tragic $37,339 |
| Malaysians | 0.7 /100 | #261 | Tragic $37,298 |
| Venezuelans | 0.7 /100 | #262 | Tragic $37,282 |
| German Russians | 0.5 /100 | #263 | Tragic $37,105 |
| Salvadorans | 0.4 /100 | #264 | Tragic $37,083 |
| Immigrants | Belize | 0.4 /100 | #265 | Tragic $37,056 |
| Dominicans | 0.4 /100 | #266 | Tragic $37,046 |
| Immigrants | Nonimmigrants | 0.4 /100 | #267 | Tragic $37,024 |
| Cree | 0.4 /100 | #268 | Tragic $37,018 |
| Immigrants | Venezuela | 0.4 /100 | #269 | Tragic $37,003 |
| French American Indians | 0.3 /100 | #270 | Tragic $36,920 |
| Nicaraguans | 0.3 /100 | #271 | Tragic $36,904 |
| Immigrants | Dominican Republic | 0.3 /100 | #272 | Tragic $36,857 |