Chippewa vs South American Indian High School Diploma
COMPARE
Chippewa
South American Indian
High School Diploma
High School Diploma Comparison
Chippewa
South American Indians
89.7%
HIGH SCHOOL DIPLOMA
85.6/ 100
METRIC RATING
135th/ 347
METRIC RANK
88.5%
HIGH SCHOOL DIPLOMA
12.2/ 100
METRIC RATING
212th/ 347
METRIC RANK
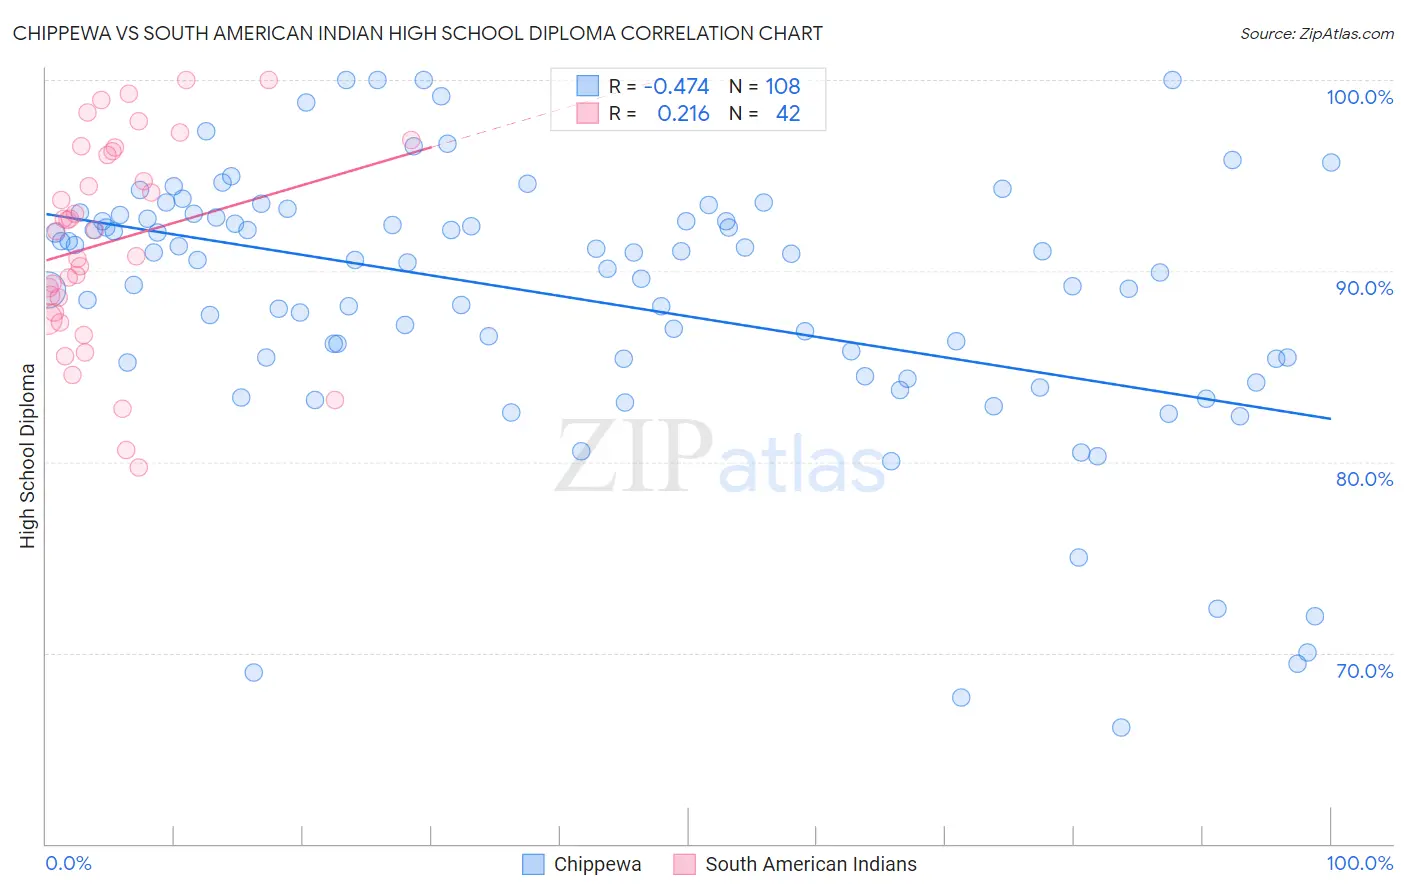
Chippewa vs South American Indian High School Diploma Correlation Chart
The statistical analysis conducted on geographies consisting of 215,068,347 people shows a moderate negative correlation between the proportion of Chippewa and percentage of population with at least high school diploma education in the United States with a correlation coefficient (R) of -0.474 and weighted average of 89.7%. Similarly, the statistical analysis conducted on geographies consisting of 164,573,088 people shows a weak positive correlation between the proportion of South American Indians and percentage of population with at least high school diploma education in the United States with a correlation coefficient (R) of 0.216 and weighted average of 88.5%, a difference of 1.4%.
High School Diploma Correlation Summary
| Measurement | Chippewa | South American Indian |
| Minimum | 66.1% | 79.7% |
| Maximum | 100.0% | 100.0% |
| Range | 33.9% | 20.3% |
| Mean | 88.6% | 91.5% |
| Median | 90.6% | 92.1% |
| Interquartile 25% (IQ1) | 85.4% | 87.8% |
| Interquartile 75% (IQ3) | 92.8% | 96.3% |
| Interquartile Range (IQR) | 7.4% | 8.5% |
| Standard Deviation (Sample) | 7.0% | 5.3% |
| Standard Deviation (Population) | 7.0% | 5.3% |
Similar Demographics by High School Diploma
Demographics Similar to Chippewa by High School Diploma
In terms of high school diploma, the demographic groups most similar to Chippewa are Immigrants from Bosnia and Herzegovina (89.8%, a difference of 0.050%), Albanian (89.8%, a difference of 0.050%), Immigrants from Jordan (89.8%, a difference of 0.050%), Immigrants from Italy (89.8%, a difference of 0.060%), and Ugandan (89.7%, a difference of 0.060%).
| Demographics | Rating | Rank | High School Diploma |
| Puget Sound Salish | 89.1 /100 | #128 | Excellent 89.9% |
| Basques | 88.5 /100 | #129 | Excellent 89.8% |
| Immigrants | Ukraine | 87.9 /100 | #130 | Excellent 89.8% |
| Immigrants | Italy | 87.4 /100 | #131 | Excellent 89.8% |
| Immigrants | Bosnia and Herzegovina | 87.3 /100 | #132 | Excellent 89.8% |
| Albanians | 87.2 /100 | #133 | Excellent 89.8% |
| Immigrants | Jordan | 87.2 /100 | #134 | Excellent 89.8% |
| Chippewa | 85.6 /100 | #135 | Excellent 89.7% |
| Ugandans | 83.7 /100 | #136 | Excellent 89.7% |
| Arabs | 83.6 /100 | #137 | Excellent 89.7% |
| Assyrians/Chaldeans/Syriacs | 82.5 /100 | #138 | Excellent 89.7% |
| Kenyans | 81.4 /100 | #139 | Excellent 89.6% |
| Immigrants | Egypt | 81.2 /100 | #140 | Excellent 89.6% |
| Chileans | 79.0 /100 | #141 | Good 89.6% |
| Indians (Asian) | 78.8 /100 | #142 | Good 89.6% |
Demographics Similar to South American Indians by High School Diploma
In terms of high school diploma, the demographic groups most similar to South American Indians are Inupiat (88.5%, a difference of 0.030%), Immigrants from Somalia (88.4%, a difference of 0.040%), Immigrants from Cameroon (88.4%, a difference of 0.050%), Crow (88.4%, a difference of 0.050%), and Samoan (88.5%, a difference of 0.060%).
| Demographics | Rating | Rank | High School Diploma |
| Immigrants | Micronesia | 16.4 /100 | #205 | Poor 88.6% |
| Arapaho | 16.1 /100 | #206 | Poor 88.6% |
| Immigrants | Sierra Leone | 15.8 /100 | #207 | Poor 88.6% |
| Portuguese | 14.4 /100 | #208 | Poor 88.5% |
| Cherokee | 14.3 /100 | #209 | Poor 88.5% |
| Samoans | 14.0 /100 | #210 | Poor 88.5% |
| Inupiat | 13.1 /100 | #211 | Poor 88.5% |
| South American Indians | 12.2 /100 | #212 | Poor 88.5% |
| Immigrants | Somalia | 11.3 /100 | #213 | Poor 88.4% |
| Immigrants | Cameroon | 10.9 /100 | #214 | Poor 88.4% |
| Crow | 10.9 /100 | #215 | Poor 88.4% |
| Chickasaw | 10.7 /100 | #216 | Poor 88.4% |
| Immigrants | Africa | 10.6 /100 | #217 | Poor 88.4% |
| Immigrants | Bolivia | 10.3 /100 | #218 | Poor 88.4% |
| Costa Ricans | 9.6 /100 | #219 | Tragic 88.4% |