Chippewa vs South American Indian Single Mother Households
COMPARE
Chippewa
South American Indian
Single Mother Households
Single Mother Households Comparison
Chippewa
South American Indians
8.0%
SINGLE MOTHER HOUSEHOLDS
0.0/ 100
METRIC RATING
301st/ 347
METRIC RANK
6.4%
SINGLE MOTHER HOUSEHOLDS
33.4/ 100
METRIC RATING
182nd/ 347
METRIC RANK
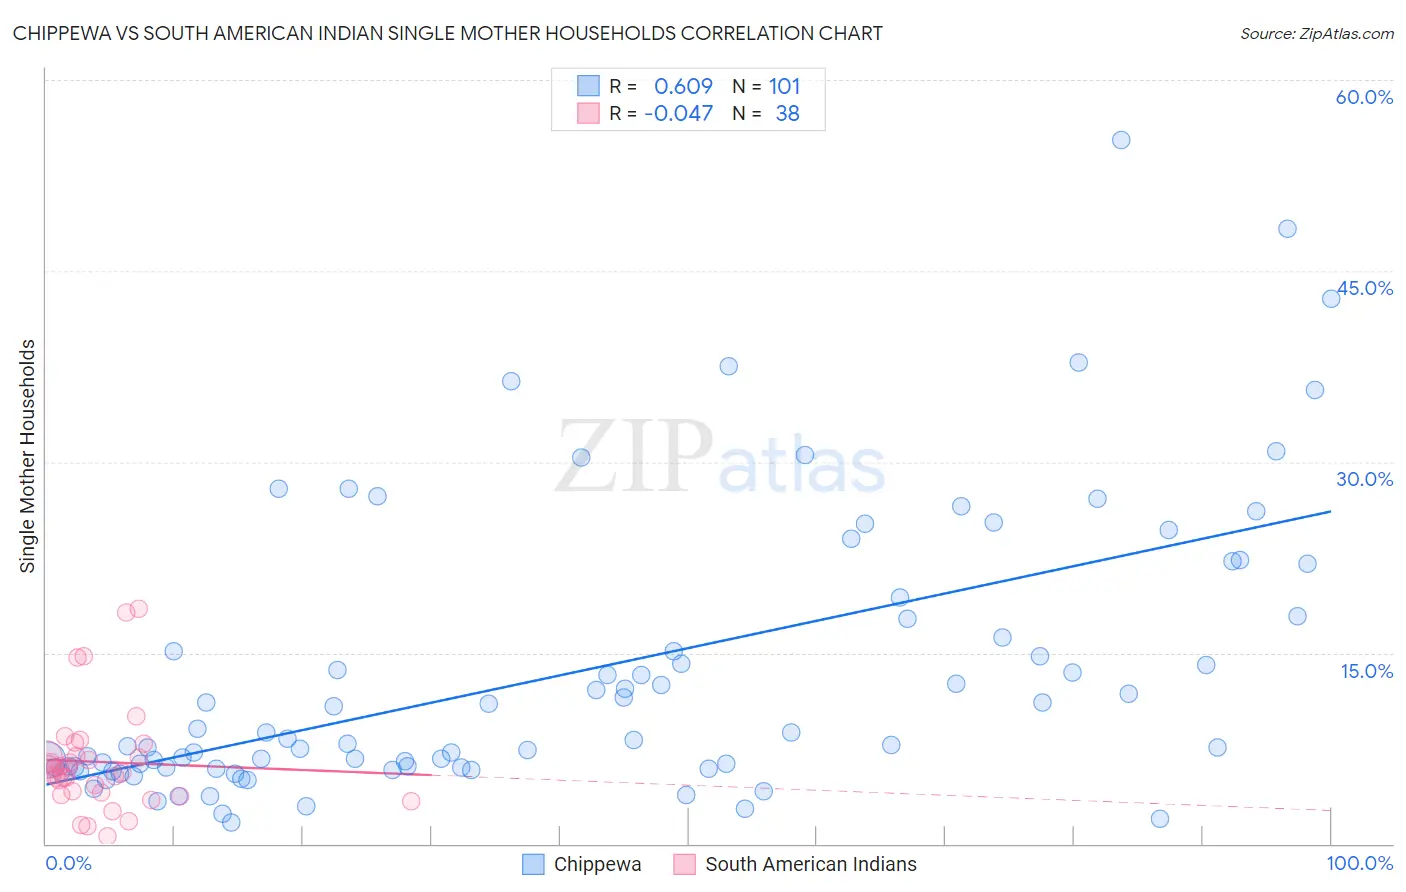
Chippewa vs South American Indian Single Mother Households Correlation Chart
The statistical analysis conducted on geographies consisting of 214,662,896 people shows a significant positive correlation between the proportion of Chippewa and percentage of single mother households in the United States with a correlation coefficient (R) of 0.609 and weighted average of 8.0%. Similarly, the statistical analysis conducted on geographies consisting of 164,464,309 people shows no correlation between the proportion of South American Indians and percentage of single mother households in the United States with a correlation coefficient (R) of -0.047 and weighted average of 6.4%, a difference of 24.0%.
Single Mother Households Correlation Summary
| Measurement | Chippewa | South American Indian |
| Minimum | 1.7% | 0.55% |
| Maximum | 55.3% | 18.4% |
| Range | 53.6% | 17.9% |
| Mean | 13.4% | 6.4% |
| Median | 8.2% | 5.7% |
| Interquartile 25% (IQ1) | 6.0% | 4.0% |
| Interquartile 75% (IQ3) | 17.8% | 6.9% |
| Interquartile Range (IQR) | 11.8% | 2.9% |
| Standard Deviation (Sample) | 11.0% | 4.1% |
| Standard Deviation (Population) | 11.0% | 4.0% |
Similar Demographics by Single Mother Households
Demographics Similar to Chippewa by Single Mother Households
In terms of single mother households, the demographic groups most similar to Chippewa are Immigrants from Ghana (8.0%, a difference of 0.10%), Immigrants from Bahamas (8.0%, a difference of 0.12%), Mexican (8.0%, a difference of 0.16%), Native/Alaskan (8.0%, a difference of 0.56%), and Colville (8.0%, a difference of 0.61%).
| Demographics | Rating | Rank | Single Mother Households |
| Apache | 0.0 /100 | #294 | Tragic 7.9% |
| Barbadians | 0.0 /100 | #295 | Tragic 7.9% |
| Immigrants | Latin America | 0.0 /100 | #296 | Tragic 7.9% |
| Hispanics or Latinos | 0.0 /100 | #297 | Tragic 7.9% |
| Immigrants | West Indies | 0.0 /100 | #298 | Tragic 7.9% |
| Houma | 0.0 /100 | #299 | Tragic 7.9% |
| Mexicans | 0.0 /100 | #300 | Tragic 8.0% |
| Chippewa | 0.0 /100 | #301 | Tragic 8.0% |
| Immigrants | Ghana | 0.0 /100 | #302 | Tragic 8.0% |
| Immigrants | Bahamas | 0.0 /100 | #303 | Tragic 8.0% |
| Natives/Alaskans | 0.0 /100 | #304 | Tragic 8.0% |
| Colville | 0.0 /100 | #305 | Tragic 8.0% |
| Immigrants | Barbados | 0.0 /100 | #306 | Tragic 8.0% |
| Immigrants | St. Vincent and the Grenadines | 0.0 /100 | #307 | Tragic 8.0% |
| Immigrants | Central America | 0.0 /100 | #308 | Tragic 8.1% |
Demographics Similar to South American Indians by Single Mother Households
In terms of single mother households, the demographic groups most similar to South American Indians are Spanish (6.4%, a difference of 0.0%), Immigrants from Nepal (6.4%, a difference of 0.32%), Spaniard (6.5%, a difference of 0.70%), Hmong (6.4%, a difference of 0.75%), and Portuguese (6.4%, a difference of 0.77%).
| Demographics | Rating | Rank | Single Mother Households |
| Marshallese | 45.8 /100 | #175 | Average 6.3% |
| Immigrants | Bosnia and Herzegovina | 44.3 /100 | #176 | Average 6.3% |
| Osage | 43.0 /100 | #177 | Average 6.4% |
| Portuguese | 40.0 /100 | #178 | Fair 6.4% |
| Hmong | 39.8 /100 | #179 | Fair 6.4% |
| Immigrants | Nepal | 36.1 /100 | #180 | Fair 6.4% |
| Spanish | 33.4 /100 | #181 | Fair 6.4% |
| South American Indians | 33.4 /100 | #182 | Fair 6.4% |
| Spaniards | 27.8 /100 | #183 | Fair 6.5% |
| Ethiopians | 26.0 /100 | #184 | Fair 6.5% |
| Ugandans | 25.6 /100 | #185 | Fair 6.5% |
| Costa Ricans | 24.8 /100 | #186 | Fair 6.5% |
| Immigrants | Afghanistan | 24.7 /100 | #187 | Fair 6.5% |
| Ottawa | 23.8 /100 | #188 | Fair 6.5% |
| Delaware | 23.3 /100 | #189 | Fair 6.5% |