Immigrants from Bangladesh vs South American Indian Median Female Earnings
COMPARE
Immigrants from Bangladesh
South American Indian
Median Female Earnings
Median Female Earnings Comparison
Immigrants from Bangladesh
South American Indians
$39,910
MEDIAN FEMALE EARNINGS
60.8/ 100
METRIC RATING
165th/ 347
METRIC RANK
$40,019
MEDIAN FEMALE EARNINGS
66.1/ 100
METRIC RATING
162nd/ 347
METRIC RANK
Immigrants from Bangladesh vs South American Indian Median Female Earnings Correlation Chart
The statistical analysis conducted on geographies consisting of 203,663,307 people shows a mild negative correlation between the proportion of Immigrants from Bangladesh and median female earnings in the United States with a correlation coefficient (R) of -0.319 and weighted average of $39,910. Similarly, the statistical analysis conducted on geographies consisting of 164,550,240 people shows a poor positive correlation between the proportion of South American Indians and median female earnings in the United States with a correlation coefficient (R) of 0.155 and weighted average of $40,019, a difference of 0.27%.
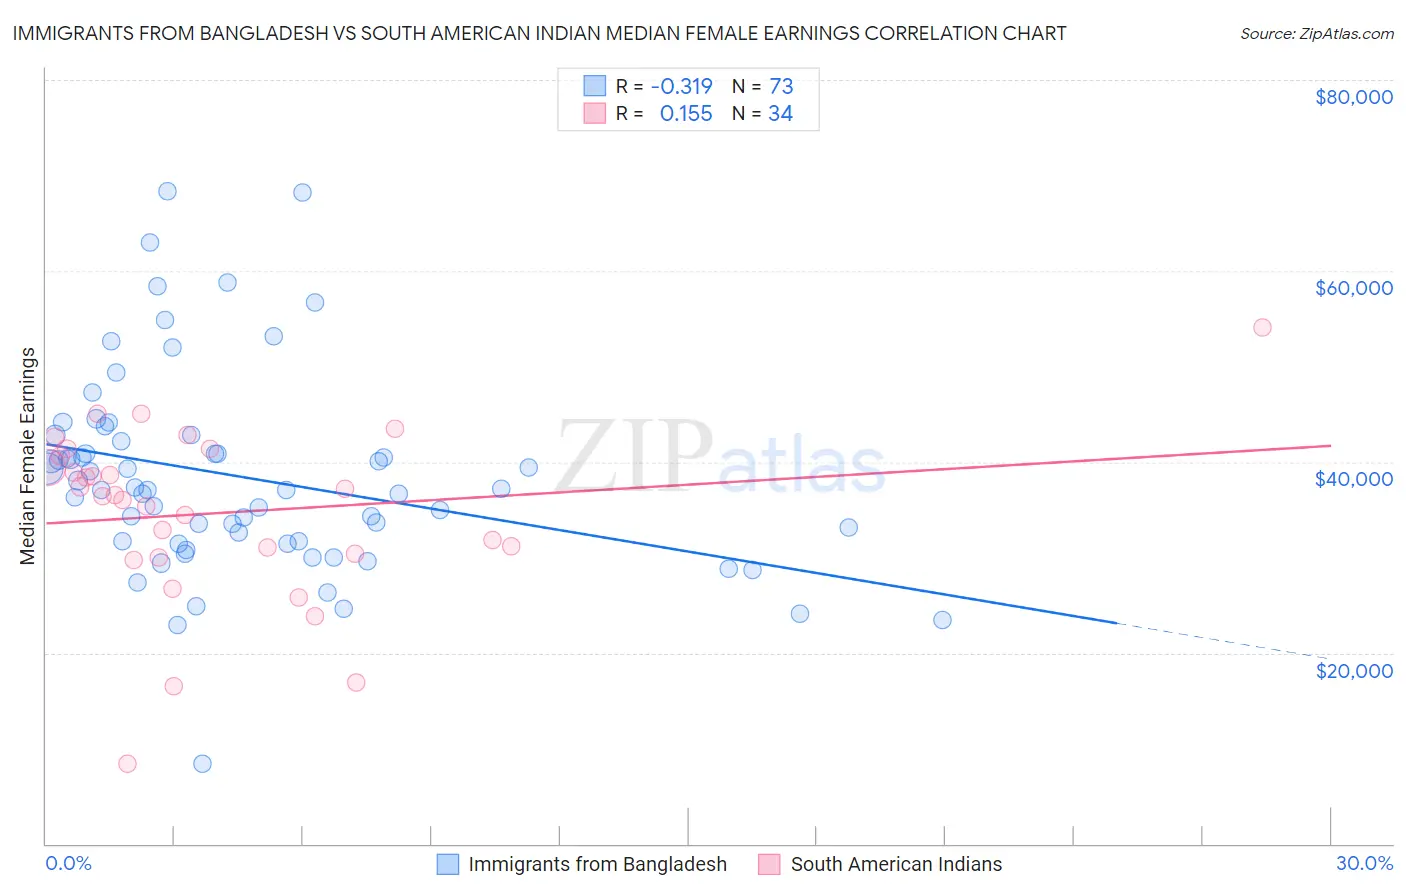
Median Female Earnings Correlation Summary
| Measurement | Immigrants from Bangladesh | South American Indian |
| Minimum | $8,380 | $8,321 |
| Maximum | $68,327 | $54,063 |
| Range | $59,947 | $45,742 |
| Mean | $38,386 | $34,663 |
| Median | $37,048 | $36,494 |
| Interquartile 25% (IQ1) | $31,570 | $30,375 |
| Interquartile 75% (IQ3) | $42,477 | $40,581 |
| Interquartile Range (IQR) | $10,907 | $10,206 |
| Standard Deviation (Sample) | $10,596 | $9,098 |
| Standard Deviation (Population) | $10,523 | $8,963 |
Demographics Similar to Immigrants from Bangladesh and South American Indians by Median Female Earnings
In terms of median female earnings, the demographic groups most similar to Immigrants from Bangladesh are Immigrants from Ghana ($39,894, a difference of 0.040%), Luxembourger ($39,891, a difference of 0.050%), Immigrants from Peru ($39,871, a difference of 0.10%), Immigrants from Saudi Arabia ($39,952, a difference of 0.11%), and Kenyan ($39,860, a difference of 0.12%). Similarly, the demographic groups most similar to South American Indians are Lebanese ($40,006, a difference of 0.030%), Alsatian ($40,060, a difference of 0.10%), Inupiat ($40,080, a difference of 0.15%), Immigrants from Saudi Arabia ($39,952, a difference of 0.17%), and Immigrants from Ghana ($39,894, a difference of 0.31%).
| Demographics | Rating | Rank | Median Female Earnings |
| British West Indians | 77.7 /100 | #153 | Good $40,299 |
| Immigrants | Oceania | 77.6 /100 | #154 | Good $40,297 |
| Immigrants | Africa | 76.2 /100 | #155 | Good $40,257 |
| Peruvians | 75.3 /100 | #156 | Good $40,234 |
| Portuguese | 73.0 /100 | #157 | Good $40,177 |
| Immigrants | Senegal | 72.2 /100 | #158 | Good $40,157 |
| Immigrants | Vietnam | 72.0 /100 | #159 | Good $40,153 |
| Inupiat | 68.9 /100 | #160 | Good $40,080 |
| Alsatians | 68.0 /100 | #161 | Good $40,060 |
| South American Indians | 66.1 /100 | #162 | Good $40,019 |
| Lebanese | 65.5 /100 | #163 | Good $40,006 |
| Immigrants | Saudi Arabia | 62.9 /100 | #164 | Good $39,952 |
| Immigrants | Bangladesh | 60.8 /100 | #165 | Good $39,910 |
| Immigrants | Ghana | 60.0 /100 | #166 | Good $39,894 |
| Luxembourgers | 59.9 /100 | #167 | Average $39,891 |
| Immigrants | Peru | 58.9 /100 | #168 | Average $39,871 |
| Kenyans | 58.4 /100 | #169 | Average $39,860 |
| Slovenes | 56.2 /100 | #170 | Average $39,817 |
| Immigrants | Portugal | 54.7 /100 | #171 | Average $39,788 |
| British | 53.8 /100 | #172 | Average $39,772 |
| Canadians | 51.4 /100 | #173 | Average $39,724 |