Salvadoran vs South American Indian Median Female Earnings
COMPARE
Salvadoran
South American Indian
Median Female Earnings
Median Female Earnings Comparison
Salvadorans
South American Indians
$37,083
MEDIAN FEMALE EARNINGS
0.4/ 100
METRIC RATING
264th/ 347
METRIC RANK
$40,019
MEDIAN FEMALE EARNINGS
66.1/ 100
METRIC RATING
162nd/ 347
METRIC RANK
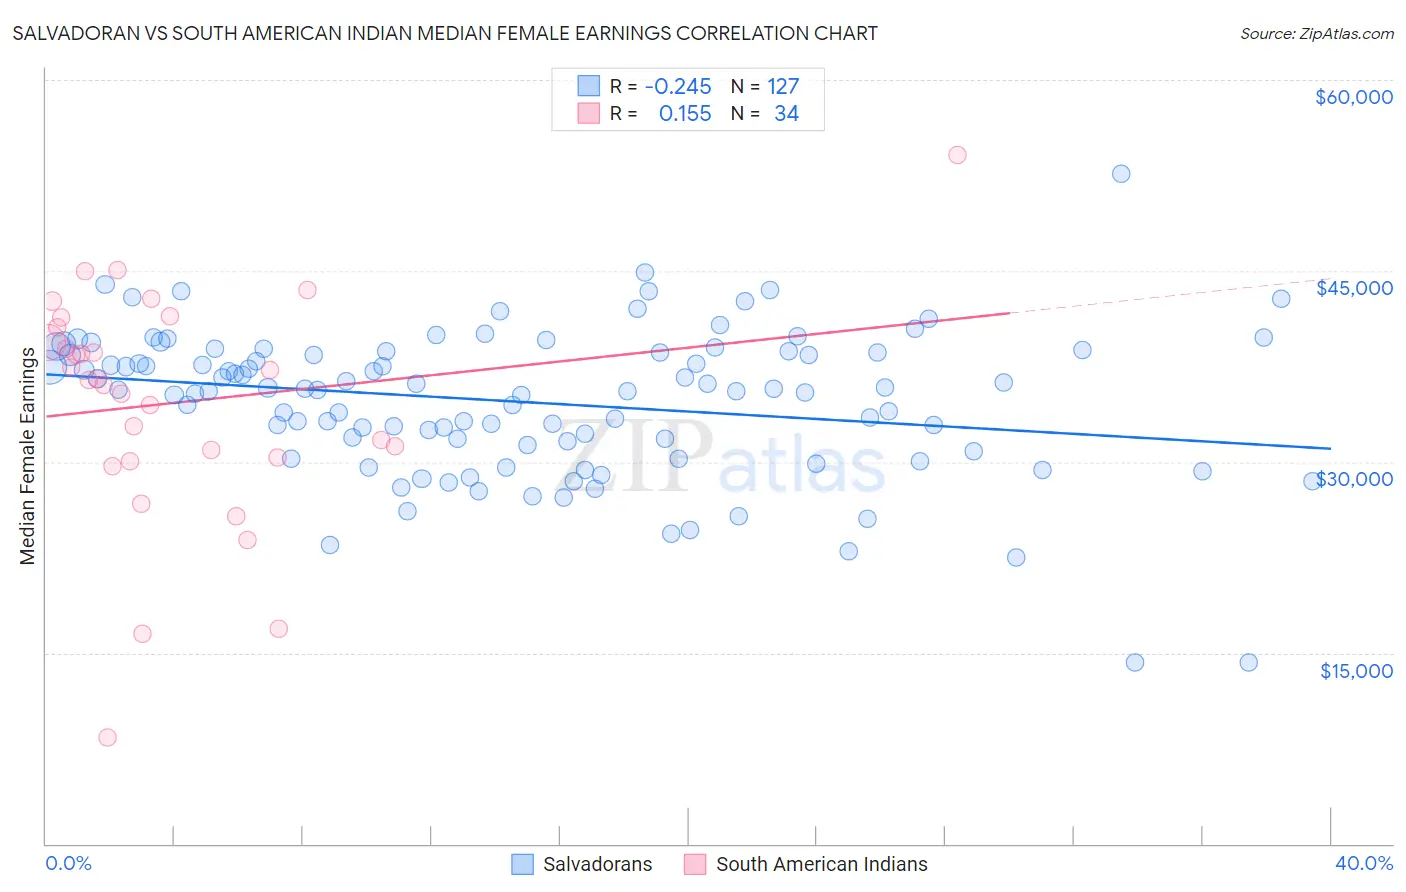
Salvadoran vs South American Indian Median Female Earnings Correlation Chart
The statistical analysis conducted on geographies consisting of 398,898,517 people shows a weak negative correlation between the proportion of Salvadorans and median female earnings in the United States with a correlation coefficient (R) of -0.245 and weighted average of $37,083. Similarly, the statistical analysis conducted on geographies consisting of 164,550,240 people shows a poor positive correlation between the proportion of South American Indians and median female earnings in the United States with a correlation coefficient (R) of 0.155 and weighted average of $40,019, a difference of 7.9%.
Median Female Earnings Correlation Summary
| Measurement | Salvadoran | South American Indian |
| Minimum | $14,245 | $8,321 |
| Maximum | $52,604 | $54,063 |
| Range | $38,359 | $45,742 |
| Mean | $34,711 | $34,663 |
| Median | $35,673 | $36,494 |
| Interquartile 25% (IQ1) | $31,372 | $30,375 |
| Interquartile 75% (IQ3) | $38,695 | $40,581 |
| Interquartile Range (IQR) | $7,323 | $10,206 |
| Standard Deviation (Sample) | $5,811 | $9,098 |
| Standard Deviation (Population) | $5,788 | $8,963 |
Similar Demographics by Median Female Earnings
Demographics Similar to Salvadorans by Median Female Earnings
In terms of median female earnings, the demographic groups most similar to Salvadorans are German Russian ($37,105, a difference of 0.060%), Immigrants from Belize ($37,056, a difference of 0.070%), Dominican ($37,046, a difference of 0.10%), Nonimmigrants ($37,024, a difference of 0.16%), and Cree ($37,018, a difference of 0.18%).
| Demographics | Rating | Rank | Median Female Earnings |
| Hawaiians | 1.0 /100 | #257 | Tragic $37,497 |
| Belizeans | 0.9 /100 | #258 | Tragic $37,429 |
| Scotch-Irish | 0.8 /100 | #259 | Tragic $37,383 |
| Dutch | 0.7 /100 | #260 | Tragic $37,339 |
| Malaysians | 0.7 /100 | #261 | Tragic $37,298 |
| Venezuelans | 0.7 /100 | #262 | Tragic $37,282 |
| German Russians | 0.5 /100 | #263 | Tragic $37,105 |
| Salvadorans | 0.4 /100 | #264 | Tragic $37,083 |
| Immigrants | Belize | 0.4 /100 | #265 | Tragic $37,056 |
| Dominicans | 0.4 /100 | #266 | Tragic $37,046 |
| Immigrants | Nonimmigrants | 0.4 /100 | #267 | Tragic $37,024 |
| Cree | 0.4 /100 | #268 | Tragic $37,018 |
| Immigrants | Venezuela | 0.4 /100 | #269 | Tragic $37,003 |
| French American Indians | 0.3 /100 | #270 | Tragic $36,920 |
| Nicaraguans | 0.3 /100 | #271 | Tragic $36,904 |
Demographics Similar to South American Indians by Median Female Earnings
In terms of median female earnings, the demographic groups most similar to South American Indians are Lebanese ($40,006, a difference of 0.030%), Alsatian ($40,060, a difference of 0.10%), Inupiat ($40,080, a difference of 0.15%), Immigrants from Saudi Arabia ($39,952, a difference of 0.17%), and Immigrants from Bangladesh ($39,910, a difference of 0.27%).
| Demographics | Rating | Rank | Median Female Earnings |
| Immigrants | Africa | 76.2 /100 | #155 | Good $40,257 |
| Peruvians | 75.3 /100 | #156 | Good $40,234 |
| Portuguese | 73.0 /100 | #157 | Good $40,177 |
| Immigrants | Senegal | 72.2 /100 | #158 | Good $40,157 |
| Immigrants | Vietnam | 72.0 /100 | #159 | Good $40,153 |
| Inupiat | 68.9 /100 | #160 | Good $40,080 |
| Alsatians | 68.0 /100 | #161 | Good $40,060 |
| South American Indians | 66.1 /100 | #162 | Good $40,019 |
| Lebanese | 65.5 /100 | #163 | Good $40,006 |
| Immigrants | Saudi Arabia | 62.9 /100 | #164 | Good $39,952 |
| Immigrants | Bangladesh | 60.8 /100 | #165 | Good $39,910 |
| Immigrants | Ghana | 60.0 /100 | #166 | Good $39,894 |
| Luxembourgers | 59.9 /100 | #167 | Average $39,891 |
| Immigrants | Peru | 58.9 /100 | #168 | Average $39,871 |
| Kenyans | 58.4 /100 | #169 | Average $39,860 |