Chinese vs South American Indian Median Female Earnings
COMPARE
Chinese
South American Indian
Median Female Earnings
Median Female Earnings Comparison
Chinese
South American Indians
$41,461
MEDIAN FEMALE EARNINGS
97.5/ 100
METRIC RATING
109th/ 347
METRIC RANK
$40,019
MEDIAN FEMALE EARNINGS
66.1/ 100
METRIC RATING
162nd/ 347
METRIC RANK
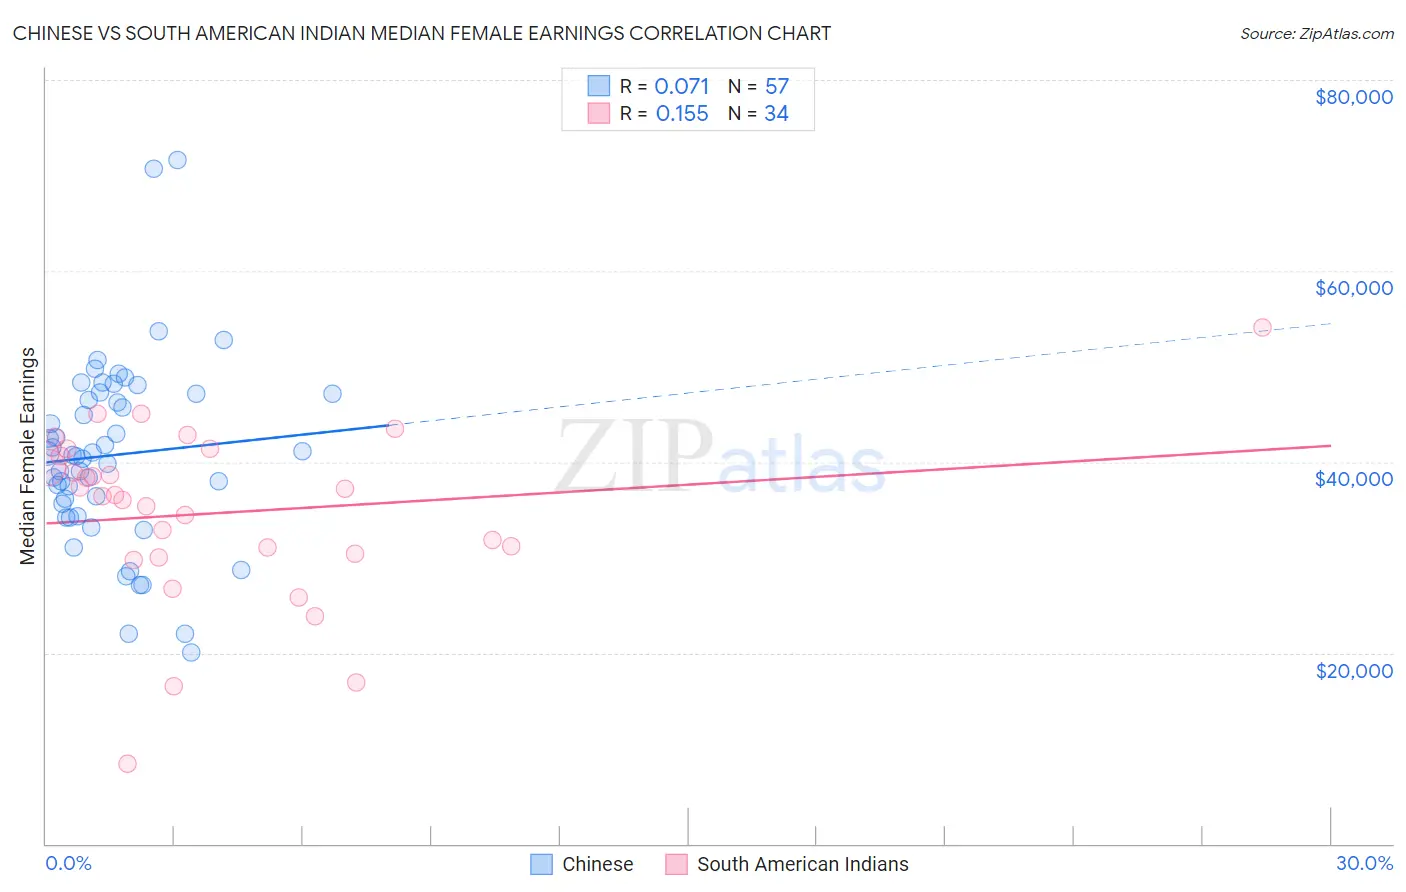
Chinese vs South American Indian Median Female Earnings Correlation Chart
The statistical analysis conducted on geographies consisting of 64,808,152 people shows a slight positive correlation between the proportion of Chinese and median female earnings in the United States with a correlation coefficient (R) of 0.071 and weighted average of $41,461. Similarly, the statistical analysis conducted on geographies consisting of 164,550,240 people shows a poor positive correlation between the proportion of South American Indians and median female earnings in the United States with a correlation coefficient (R) of 0.155 and weighted average of $40,019, a difference of 3.6%.
Median Female Earnings Correlation Summary
| Measurement | Chinese | South American Indian |
| Minimum | $20,043 | $8,321 |
| Maximum | $71,591 | $54,063 |
| Range | $51,548 | $45,742 |
| Mean | $40,727 | $34,663 |
| Median | $40,673 | $36,494 |
| Interquartile 25% (IQ1) | $34,915 | $30,375 |
| Interquartile 75% (IQ3) | $47,174 | $40,581 |
| Interquartile Range (IQR) | $12,258 | $10,206 |
| Standard Deviation (Sample) | $9,803 | $9,098 |
| Standard Deviation (Population) | $9,716 | $8,963 |
Similar Demographics by Median Female Earnings
Demographics Similar to Chinese by Median Female Earnings
In terms of median female earnings, the demographic groups most similar to Chinese are Jordanian ($41,464, a difference of 0.010%), Palestinian ($41,484, a difference of 0.050%), Immigrants from Eritrea ($41,485, a difference of 0.060%), Italian ($41,505, a difference of 0.10%), and Immigrants from Zimbabwe ($41,527, a difference of 0.16%).
| Demographics | Rating | Rank | Median Female Earnings |
| Immigrants | Poland | 98.2 /100 | #102 | Exceptional $41,630 |
| Immigrants | Argentina | 97.9 /100 | #103 | Exceptional $41,554 |
| Immigrants | Zimbabwe | 97.8 /100 | #104 | Exceptional $41,527 |
| Italians | 97.7 /100 | #105 | Exceptional $41,505 |
| Immigrants | Eritrea | 97.6 /100 | #106 | Exceptional $41,485 |
| Palestinians | 97.6 /100 | #107 | Exceptional $41,484 |
| Jordanians | 97.5 /100 | #108 | Exceptional $41,464 |
| Chinese | 97.5 /100 | #109 | Exceptional $41,461 |
| Immigrants | Western Asia | 97.0 /100 | #110 | Exceptional $41,375 |
| Immigrants | Canada | 97.0 /100 | #111 | Exceptional $41,373 |
| Immigrants | North America | 96.7 /100 | #112 | Exceptional $41,319 |
| Macedonians | 96.4 /100 | #113 | Exceptional $41,286 |
| Immigrants | England | 96.4 /100 | #114 | Exceptional $41,277 |
| Koreans | 96.4 /100 | #115 | Exceptional $41,276 |
| Immigrants | Brazil | 96.4 /100 | #116 | Exceptional $41,273 |
Demographics Similar to South American Indians by Median Female Earnings
In terms of median female earnings, the demographic groups most similar to South American Indians are Lebanese ($40,006, a difference of 0.030%), Alsatian ($40,060, a difference of 0.10%), Inupiat ($40,080, a difference of 0.15%), Immigrants from Saudi Arabia ($39,952, a difference of 0.17%), and Immigrants from Bangladesh ($39,910, a difference of 0.27%).
| Demographics | Rating | Rank | Median Female Earnings |
| Immigrants | Africa | 76.2 /100 | #155 | Good $40,257 |
| Peruvians | 75.3 /100 | #156 | Good $40,234 |
| Portuguese | 73.0 /100 | #157 | Good $40,177 |
| Immigrants | Senegal | 72.2 /100 | #158 | Good $40,157 |
| Immigrants | Vietnam | 72.0 /100 | #159 | Good $40,153 |
| Inupiat | 68.9 /100 | #160 | Good $40,080 |
| Alsatians | 68.0 /100 | #161 | Good $40,060 |
| South American Indians | 66.1 /100 | #162 | Good $40,019 |
| Lebanese | 65.5 /100 | #163 | Good $40,006 |
| Immigrants | Saudi Arabia | 62.9 /100 | #164 | Good $39,952 |
| Immigrants | Bangladesh | 60.8 /100 | #165 | Good $39,910 |
| Immigrants | Ghana | 60.0 /100 | #166 | Good $39,894 |
| Luxembourgers | 59.9 /100 | #167 | Average $39,891 |
| Immigrants | Peru | 58.9 /100 | #168 | Average $39,871 |
| Kenyans | 58.4 /100 | #169 | Average $39,860 |