Chippewa vs Immigrants from Somalia Median Earnings
COMPARE
Chippewa
Immigrants from Somalia
Median Earnings
Median Earnings Comparison
Chippewa
Immigrants from Somalia
$40,287
MEDIAN EARNINGS
0.0/ 100
METRIC RATING
312th/ 347
METRIC RANK
$43,100
MEDIAN EARNINGS
0.9/ 100
METRIC RATING
260th/ 347
METRIC RANK
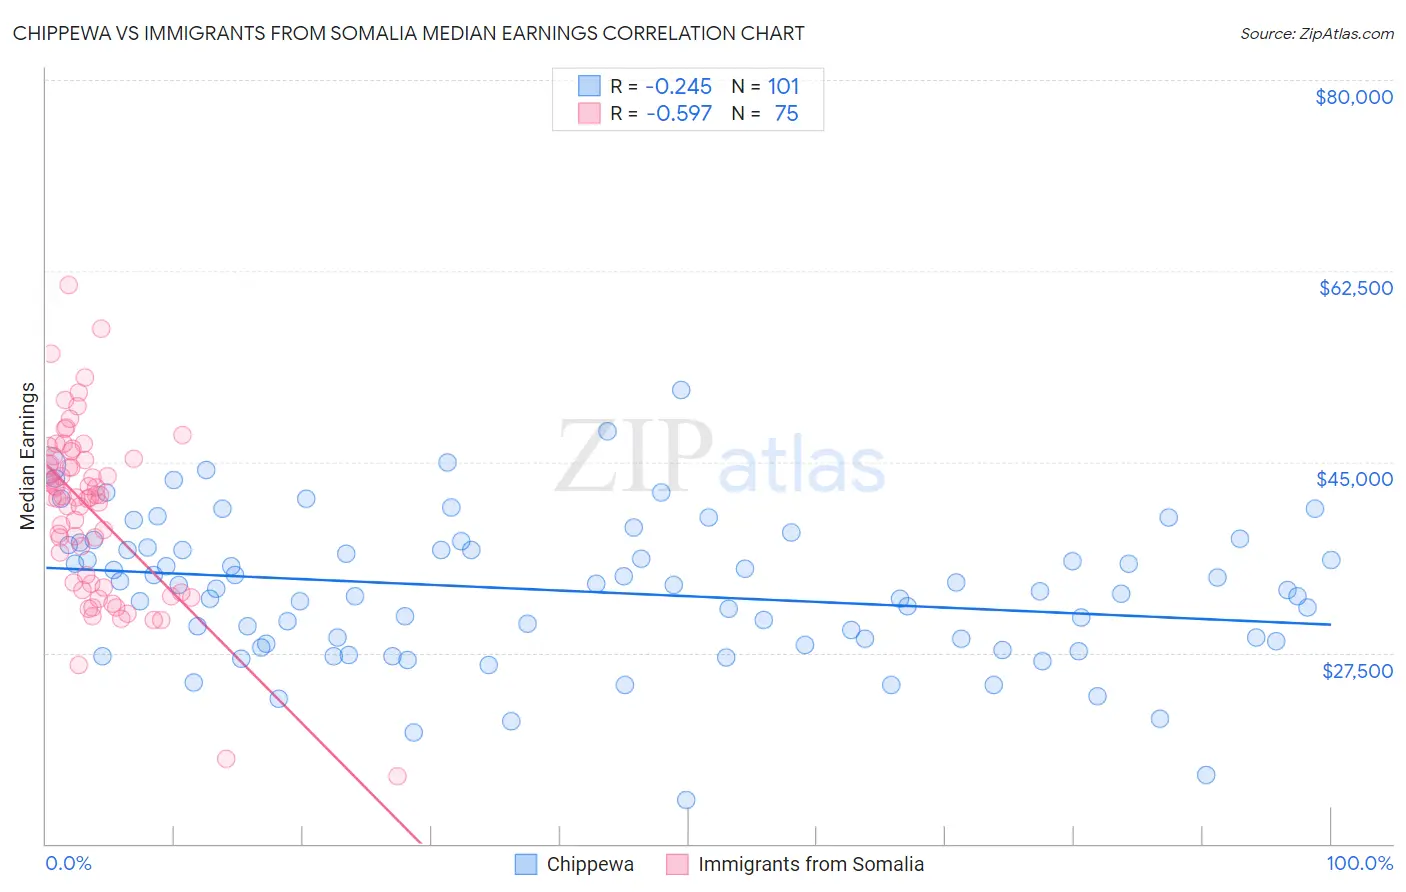
Chippewa vs Immigrants from Somalia Median Earnings Correlation Chart
The statistical analysis conducted on geographies consisting of 215,041,296 people shows a weak negative correlation between the proportion of Chippewa and median earnings in the United States with a correlation coefficient (R) of -0.245 and weighted average of $40,287. Similarly, the statistical analysis conducted on geographies consisting of 92,110,965 people shows a substantial negative correlation between the proportion of Immigrants from Somalia and median earnings in the United States with a correlation coefficient (R) of -0.597 and weighted average of $43,100, a difference of 7.0%.
Median Earnings Correlation Summary
| Measurement | Chippewa | Immigrants from Somalia |
| Minimum | $14,000 | $16,214 |
| Maximum | $51,563 | $61,239 |
| Range | $37,563 | $45,025 |
| Mean | $33,174 | $40,509 |
| Median | $33,342 | $41,780 |
| Interquartile 25% (IQ1) | $28,488 | $33,809 |
| Interquartile 75% (IQ3) | $37,270 | $45,326 |
| Interquartile Range (IQR) | $8,782 | $11,517 |
| Standard Deviation (Sample) | $6,612 | $7,944 |
| Standard Deviation (Population) | $6,579 | $7,891 |
Similar Demographics by Median Earnings
Demographics Similar to Chippewa by Median Earnings
In terms of median earnings, the demographic groups most similar to Chippewa are Hispanic or Latino ($40,288, a difference of 0.0%), Choctaw ($40,270, a difference of 0.040%), Cheyenne ($40,233, a difference of 0.13%), Seminole ($40,233, a difference of 0.13%), and Immigrants from Honduras ($40,195, a difference of 0.23%).
| Demographics | Rating | Rank | Median Earnings |
| Chickasaw | 0.0 /100 | #305 | Tragic $40,672 |
| Yaqui | 0.0 /100 | #306 | Tragic $40,647 |
| Hondurans | 0.0 /100 | #307 | Tragic $40,638 |
| Cubans | 0.0 /100 | #308 | Tragic $40,619 |
| Immigrants | Haiti | 0.0 /100 | #309 | Tragic $40,550 |
| Apache | 0.0 /100 | #310 | Tragic $40,388 |
| Hispanics or Latinos | 0.0 /100 | #311 | Tragic $40,288 |
| Chippewa | 0.0 /100 | #312 | Tragic $40,287 |
| Choctaw | 0.0 /100 | #313 | Tragic $40,270 |
| Cheyenne | 0.0 /100 | #314 | Tragic $40,233 |
| Seminole | 0.0 /100 | #315 | Tragic $40,233 |
| Immigrants | Honduras | 0.0 /100 | #316 | Tragic $40,195 |
| Fijians | 0.0 /100 | #317 | Tragic $40,193 |
| Dutch West Indians | 0.0 /100 | #318 | Tragic $40,107 |
| Blacks/African Americans | 0.0 /100 | #319 | Tragic $40,085 |
Demographics Similar to Immigrants from Somalia by Median Earnings
In terms of median earnings, the demographic groups most similar to Immigrants from Somalia are Immigrants from Jamaica ($43,026, a difference of 0.17%), Nicaraguan ($43,026, a difference of 0.17%), German Russian ($43,200, a difference of 0.23%), Inupiat ($43,000, a difference of 0.23%), and Immigrants from Liberia ($42,923, a difference of 0.41%).
| Demographics | Rating | Rank | Median Earnings |
| Somalis | 1.8 /100 | #253 | Tragic $43,567 |
| Liberians | 1.7 /100 | #254 | Tragic $43,536 |
| Immigrants | Middle Africa | 1.4 /100 | #255 | Tragic $43,416 |
| Alaskan Athabascans | 1.4 /100 | #256 | Tragic $43,393 |
| Jamaicans | 1.3 /100 | #257 | Tragic $43,343 |
| French American Indians | 1.3 /100 | #258 | Tragic $43,333 |
| German Russians | 1.1 /100 | #259 | Tragic $43,200 |
| Immigrants | Somalia | 0.9 /100 | #260 | Tragic $43,100 |
| Immigrants | Jamaica | 0.8 /100 | #261 | Tragic $43,026 |
| Nicaraguans | 0.8 /100 | #262 | Tragic $43,026 |
| Inupiat | 0.8 /100 | #263 | Tragic $43,000 |
| Immigrants | Liberia | 0.7 /100 | #264 | Tragic $42,923 |
| Salvadorans | 0.7 /100 | #265 | Tragic $42,912 |
| Immigrants | Laos | 0.7 /100 | #266 | Tragic $42,884 |
| Cree | 0.6 /100 | #267 | Tragic $42,777 |