Creek vs Immigrants from Somalia Median Earnings
COMPARE
Creek
Immigrants from Somalia
Median Earnings
Median Earnings Comparison
Creek
Immigrants from Somalia
$39,648
MEDIAN EARNINGS
0.0/ 100
METRIC RATING
325th/ 347
METRIC RANK
$43,100
MEDIAN EARNINGS
0.9/ 100
METRIC RATING
260th/ 347
METRIC RANK
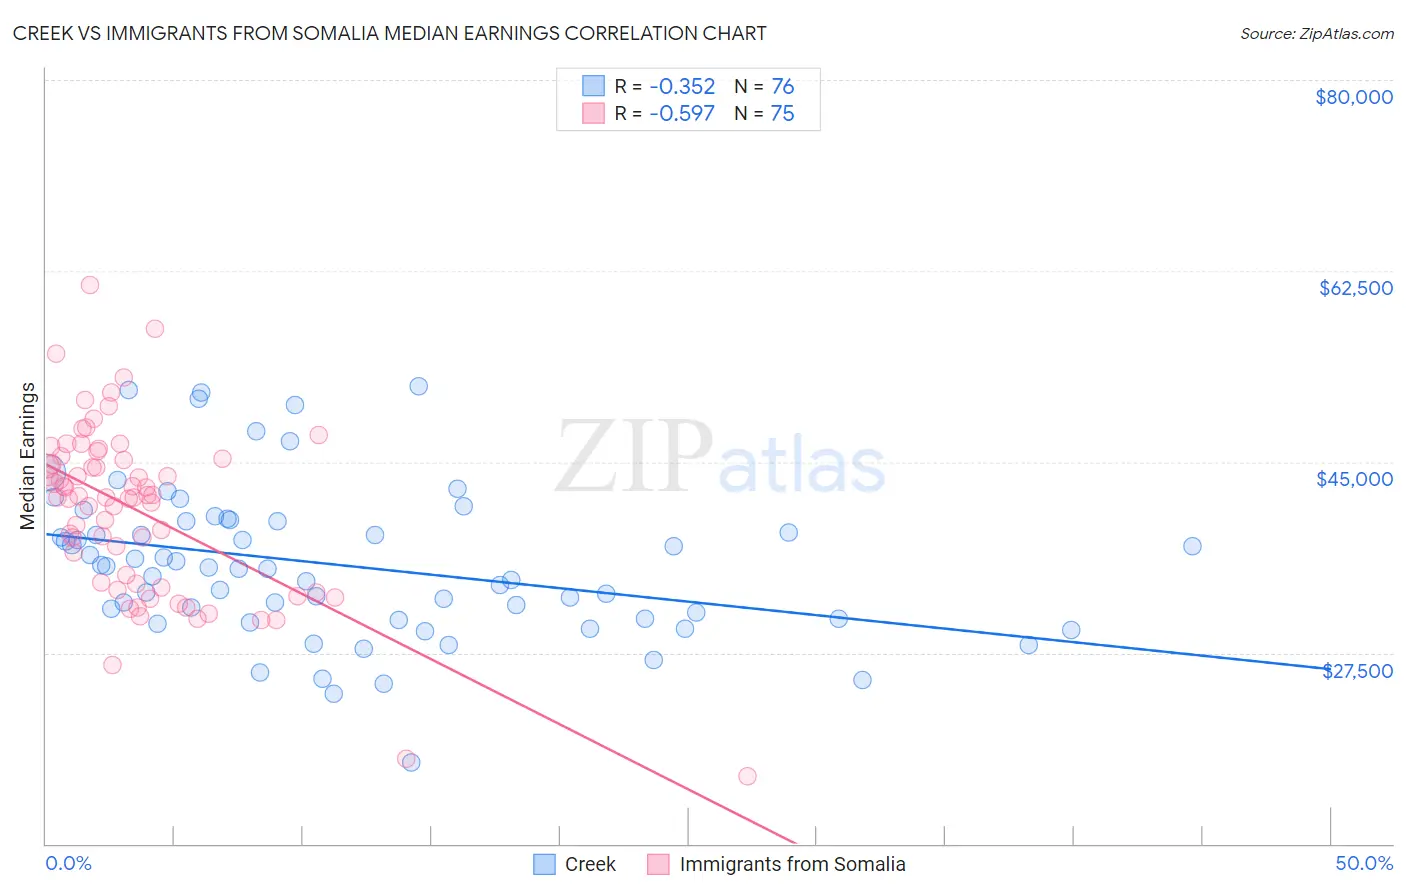
Creek vs Immigrants from Somalia Median Earnings Correlation Chart
The statistical analysis conducted on geographies consisting of 178,470,234 people shows a mild negative correlation between the proportion of Creek and median earnings in the United States with a correlation coefficient (R) of -0.352 and weighted average of $39,648. Similarly, the statistical analysis conducted on geographies consisting of 92,110,965 people shows a substantial negative correlation between the proportion of Immigrants from Somalia and median earnings in the United States with a correlation coefficient (R) of -0.597 and weighted average of $43,100, a difference of 8.7%.
Median Earnings Correlation Summary
| Measurement | Creek | Immigrants from Somalia |
| Minimum | $17,500 | $16,214 |
| Maximum | $51,875 | $61,239 |
| Range | $34,375 | $45,025 |
| Mean | $35,536 | $40,509 |
| Median | $35,262 | $41,780 |
| Interquartile 25% (IQ1) | $30,664 | $33,809 |
| Interquartile 75% (IQ3) | $39,531 | $45,326 |
| Interquartile Range (IQR) | $8,868 | $11,517 |
| Standard Deviation (Sample) | $6,944 | $7,944 |
| Standard Deviation (Population) | $6,899 | $7,891 |
Similar Demographics by Median Earnings
Demographics Similar to Creek by Median Earnings
In terms of median earnings, the demographic groups most similar to Creek are Ottawa ($39,721, a difference of 0.18%), Bahamian ($39,735, a difference of 0.22%), Immigrants from Yemen ($39,540, a difference of 0.27%), Immigrants from Central America ($39,762, a difference of 0.29%), and Yuman ($39,523, a difference of 0.32%).
| Demographics | Rating | Rank | Median Earnings |
| Dutch West Indians | 0.0 /100 | #318 | Tragic $40,107 |
| Blacks/African Americans | 0.0 /100 | #319 | Tragic $40,085 |
| Immigrants | Bahamas | 0.0 /100 | #320 | Tragic $39,861 |
| Mexicans | 0.0 /100 | #321 | Tragic $39,834 |
| Immigrants | Central America | 0.0 /100 | #322 | Tragic $39,762 |
| Bahamians | 0.0 /100 | #323 | Tragic $39,735 |
| Ottawa | 0.0 /100 | #324 | Tragic $39,721 |
| Creek | 0.0 /100 | #325 | Tragic $39,648 |
| Immigrants | Yemen | 0.0 /100 | #326 | Tragic $39,540 |
| Yuman | 0.0 /100 | #327 | Tragic $39,523 |
| Sioux | 0.0 /100 | #328 | Tragic $39,448 |
| Kiowa | 0.0 /100 | #329 | Tragic $39,232 |
| Immigrants | Congo | 0.0 /100 | #330 | Tragic $39,169 |
| Immigrants | Mexico | 0.0 /100 | #331 | Tragic $39,114 |
| Yakama | 0.0 /100 | #332 | Tragic $39,107 |
Demographics Similar to Immigrants from Somalia by Median Earnings
In terms of median earnings, the demographic groups most similar to Immigrants from Somalia are Immigrants from Jamaica ($43,026, a difference of 0.17%), Nicaraguan ($43,026, a difference of 0.17%), German Russian ($43,200, a difference of 0.23%), Inupiat ($43,000, a difference of 0.23%), and Immigrants from Liberia ($42,923, a difference of 0.41%).
| Demographics | Rating | Rank | Median Earnings |
| Somalis | 1.8 /100 | #253 | Tragic $43,567 |
| Liberians | 1.7 /100 | #254 | Tragic $43,536 |
| Immigrants | Middle Africa | 1.4 /100 | #255 | Tragic $43,416 |
| Alaskan Athabascans | 1.4 /100 | #256 | Tragic $43,393 |
| Jamaicans | 1.3 /100 | #257 | Tragic $43,343 |
| French American Indians | 1.3 /100 | #258 | Tragic $43,333 |
| German Russians | 1.1 /100 | #259 | Tragic $43,200 |
| Immigrants | Somalia | 0.9 /100 | #260 | Tragic $43,100 |
| Immigrants | Jamaica | 0.8 /100 | #261 | Tragic $43,026 |
| Nicaraguans | 0.8 /100 | #262 | Tragic $43,026 |
| Inupiat | 0.8 /100 | #263 | Tragic $43,000 |
| Immigrants | Liberia | 0.7 /100 | #264 | Tragic $42,923 |
| Salvadorans | 0.7 /100 | #265 | Tragic $42,912 |
| Immigrants | Laos | 0.7 /100 | #266 | Tragic $42,884 |
| Cree | 0.6 /100 | #267 | Tragic $42,777 |