Potawatomi vs Immigrants from Somalia Median Earnings
COMPARE
Potawatomi
Immigrants from Somalia
Median Earnings
Median Earnings Comparison
Potawatomi
Immigrants from Somalia
$41,288
MEDIAN EARNINGS
0.1/ 100
METRIC RATING
294th/ 347
METRIC RANK
$43,100
MEDIAN EARNINGS
0.9/ 100
METRIC RATING
260th/ 347
METRIC RANK
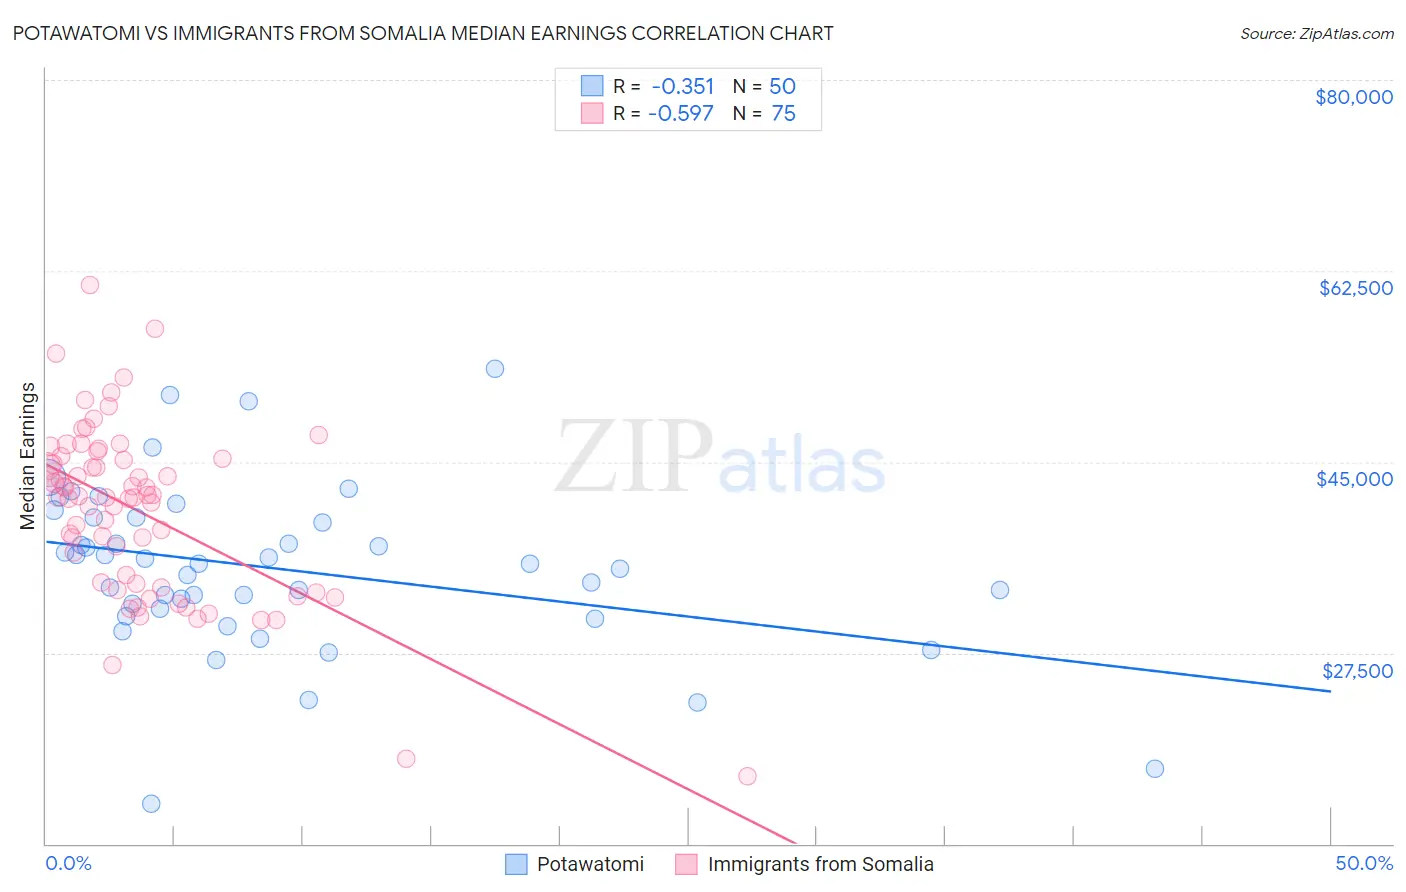
Potawatomi vs Immigrants from Somalia Median Earnings Correlation Chart
The statistical analysis conducted on geographies consisting of 117,770,629 people shows a mild negative correlation between the proportion of Potawatomi and median earnings in the United States with a correlation coefficient (R) of -0.351 and weighted average of $41,288. Similarly, the statistical analysis conducted on geographies consisting of 92,110,965 people shows a substantial negative correlation between the proportion of Immigrants from Somalia and median earnings in the United States with a correlation coefficient (R) of -0.597 and weighted average of $43,100, a difference of 4.4%.
Median Earnings Correlation Summary
| Measurement | Potawatomi | Immigrants from Somalia |
| Minimum | $13,611 | $16,214 |
| Maximum | $53,523 | $61,239 |
| Range | $39,912 | $45,025 |
| Mean | $35,226 | $40,509 |
| Median | $35,630 | $41,780 |
| Interquartile 25% (IQ1) | $31,586 | $33,809 |
| Interquartile 75% (IQ3) | $39,871 | $45,326 |
| Interquartile Range (IQR) | $8,285 | $11,517 |
| Standard Deviation (Sample) | $7,629 | $7,944 |
| Standard Deviation (Population) | $7,552 | $7,891 |
Similar Demographics by Median Earnings
Demographics Similar to Potawatomi by Median Earnings
In terms of median earnings, the demographic groups most similar to Potawatomi are Bangladeshi ($41,263, a difference of 0.060%), Immigrants from Zaire ($41,325, a difference of 0.090%), Cherokee ($41,252, a difference of 0.090%), Guatemalan ($41,205, a difference of 0.20%), and Immigrants from Micronesia ($41,133, a difference of 0.38%).
| Demographics | Rating | Rank | Median Earnings |
| Indonesians | 0.1 /100 | #287 | Tragic $41,701 |
| Immigrants | Dominican Republic | 0.1 /100 | #288 | Tragic $41,554 |
| Comanche | 0.1 /100 | #289 | Tragic $41,519 |
| Paiute | 0.1 /100 | #290 | Tragic $41,508 |
| Central American Indians | 0.1 /100 | #291 | Tragic $41,474 |
| U.S. Virgin Islanders | 0.1 /100 | #292 | Tragic $41,448 |
| Immigrants | Zaire | 0.1 /100 | #293 | Tragic $41,325 |
| Potawatomi | 0.1 /100 | #294 | Tragic $41,288 |
| Bangladeshis | 0.1 /100 | #295 | Tragic $41,263 |
| Cherokee | 0.1 /100 | #296 | Tragic $41,252 |
| Guatemalans | 0.1 /100 | #297 | Tragic $41,205 |
| Immigrants | Micronesia | 0.1 /100 | #298 | Tragic $41,133 |
| Immigrants | Caribbean | 0.1 /100 | #299 | Tragic $41,119 |
| Ute | 0.1 /100 | #300 | Tragic $41,051 |
| Immigrants | Latin America | 0.1 /100 | #301 | Tragic $41,049 |
Demographics Similar to Immigrants from Somalia by Median Earnings
In terms of median earnings, the demographic groups most similar to Immigrants from Somalia are Immigrants from Jamaica ($43,026, a difference of 0.17%), Nicaraguan ($43,026, a difference of 0.17%), German Russian ($43,200, a difference of 0.23%), Inupiat ($43,000, a difference of 0.23%), and Immigrants from Liberia ($42,923, a difference of 0.41%).
| Demographics | Rating | Rank | Median Earnings |
| Somalis | 1.8 /100 | #253 | Tragic $43,567 |
| Liberians | 1.7 /100 | #254 | Tragic $43,536 |
| Immigrants | Middle Africa | 1.4 /100 | #255 | Tragic $43,416 |
| Alaskan Athabascans | 1.4 /100 | #256 | Tragic $43,393 |
| Jamaicans | 1.3 /100 | #257 | Tragic $43,343 |
| French American Indians | 1.3 /100 | #258 | Tragic $43,333 |
| German Russians | 1.1 /100 | #259 | Tragic $43,200 |
| Immigrants | Somalia | 0.9 /100 | #260 | Tragic $43,100 |
| Immigrants | Jamaica | 0.8 /100 | #261 | Tragic $43,026 |
| Nicaraguans | 0.8 /100 | #262 | Tragic $43,026 |
| Inupiat | 0.8 /100 | #263 | Tragic $43,000 |
| Immigrants | Liberia | 0.7 /100 | #264 | Tragic $42,923 |
| Salvadorans | 0.7 /100 | #265 | Tragic $42,912 |
| Immigrants | Laos | 0.7 /100 | #266 | Tragic $42,884 |
| Cree | 0.6 /100 | #267 | Tragic $42,777 |