Chippewa vs Immigrants from Somalia In Labor Force | Age 20-24
COMPARE
Chippewa
Immigrants from Somalia
In Labor Force | Age 20-24
In Labor Force | Age 20-24 Comparison
Chippewa
Immigrants from Somalia
77.1%
IN LABOR FORCE | AGE 20-24
99.9/ 100
METRIC RATING
57th/ 347
METRIC RANK
79.5%
IN LABOR FORCE | AGE 20-24
100.0/ 100
METRIC RATING
2nd/ 347
METRIC RANK
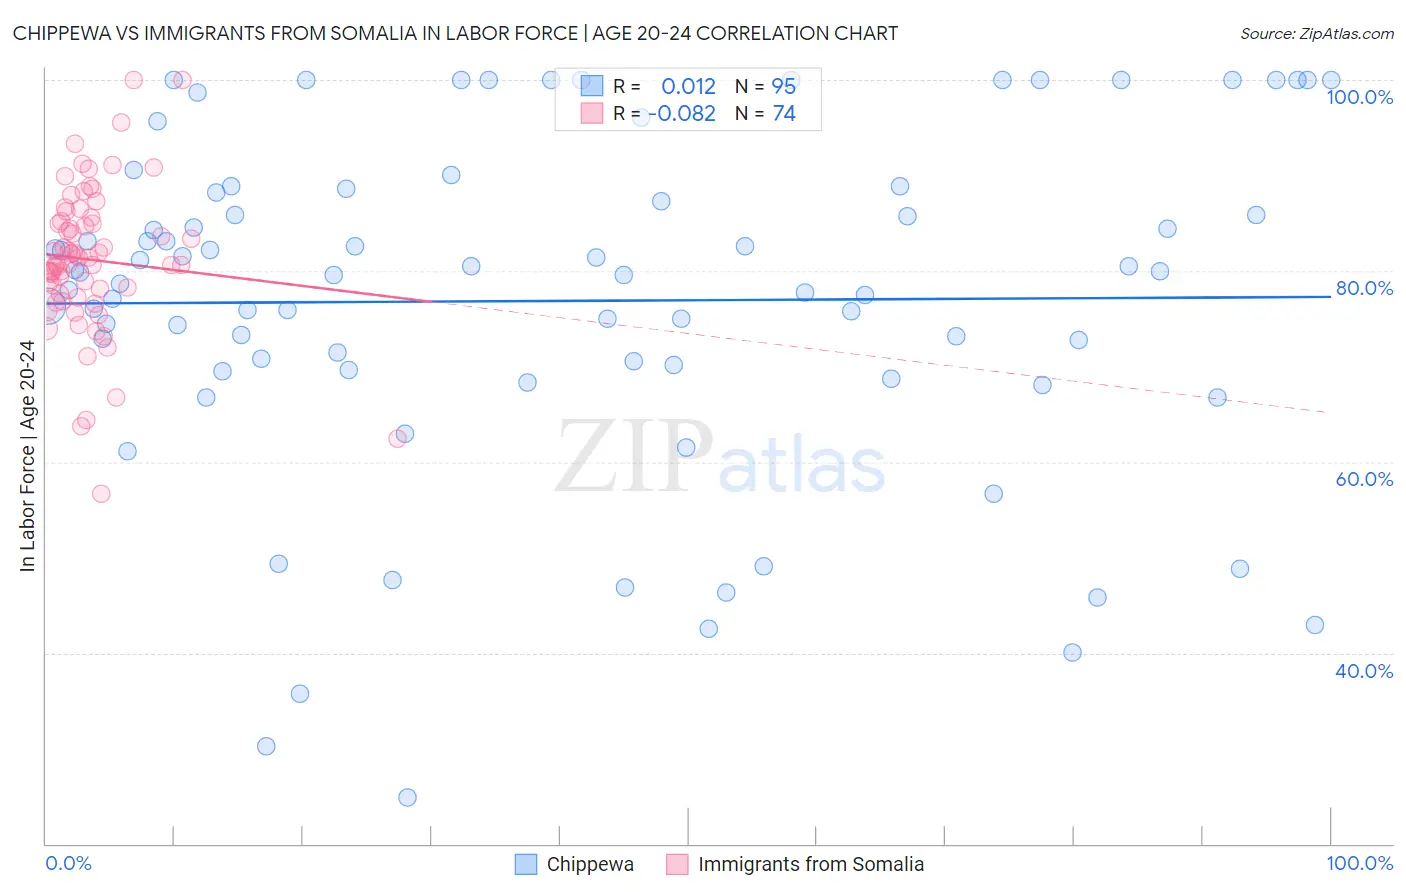
Chippewa vs Immigrants from Somalia In Labor Force | Age 20-24 Correlation Chart
The statistical analysis conducted on geographies consisting of 214,944,357 people shows no correlation between the proportion of Chippewa and labor force participation rate among population between the ages 20 and 24 in the United States with a correlation coefficient (R) of 0.012 and weighted average of 77.1%. Similarly, the statistical analysis conducted on geographies consisting of 92,105,737 people shows a slight negative correlation between the proportion of Immigrants from Somalia and labor force participation rate among population between the ages 20 and 24 in the United States with a correlation coefficient (R) of -0.082 and weighted average of 79.5%, a difference of 3.2%.
In Labor Force | Age 20-24 Correlation Summary
| Measurement | Chippewa | Immigrants from Somalia |
| Minimum | 24.8% | 56.6% |
| Maximum | 100.0% | 100.0% |
| Range | 75.2% | 43.4% |
| Mean | 76.9% | 81.2% |
| Median | 79.6% | 81.1% |
| Interquartile 25% (IQ1) | 69.6% | 77.7% |
| Interquartile 75% (IQ3) | 88.2% | 85.2% |
| Interquartile Range (IQR) | 18.6% | 7.5% |
| Standard Deviation (Sample) | 17.6% | 7.7% |
| Standard Deviation (Population) | 17.5% | 7.7% |
Similar Demographics by In Labor Force | Age 20-24
Demographics Similar to Chippewa by In Labor Force | Age 20-24
In terms of in labor force | age 20-24, the demographic groups most similar to Chippewa are Immigrants from Liberia (77.1%, a difference of 0.020%), European (77.1%, a difference of 0.020%), Hawaiian (77.0%, a difference of 0.020%), Celtic (77.1%, a difference of 0.040%), and Scotch-Irish (77.0%, a difference of 0.050%).
| Demographics | Rating | Rank | In Labor Force | Age 20-24 |
| Malaysians | 100.0 /100 | #50 | Exceptional 77.2% |
| Croatians | 100.0 /100 | #51 | Exceptional 77.2% |
| Indonesians | 100.0 /100 | #52 | Exceptional 77.2% |
| Immigrants | Azores | 100.0 /100 | #53 | Exceptional 77.2% |
| Celtics | 99.9 /100 | #54 | Exceptional 77.1% |
| Immigrants | Liberia | 99.9 /100 | #55 | Exceptional 77.1% |
| Europeans | 99.9 /100 | #56 | Exceptional 77.1% |
| Chippewa | 99.9 /100 | #57 | Exceptional 77.1% |
| Hawaiians | 99.9 /100 | #58 | Exceptional 77.0% |
| Scotch-Irish | 99.9 /100 | #59 | Exceptional 77.0% |
| Kenyans | 99.9 /100 | #60 | Exceptional 77.0% |
| Immigrants | Eritrea | 99.9 /100 | #61 | Exceptional 77.0% |
| Immigrants | Kenya | 99.9 /100 | #62 | Exceptional 77.0% |
| Lithuanians | 99.9 /100 | #63 | Exceptional 77.0% |
| Whites/Caucasians | 99.9 /100 | #64 | Exceptional 76.9% |
Demographics Similar to Immigrants from Somalia by In Labor Force | Age 20-24
In terms of in labor force | age 20-24, the demographic groups most similar to Immigrants from Somalia are Somali (79.3%, a difference of 0.36%), Alaskan Athabascan (79.1%, a difference of 0.55%), Aleut (79.0%, a difference of 0.69%), Danish (79.0%, a difference of 0.70%), and Luxembourger (79.0%, a difference of 0.74%).
| Demographics | Rating | Rank | In Labor Force | Age 20-24 |
| Norwegians | 100.0 /100 | #1 | Exceptional 80.1% |
| Immigrants | Somalia | 100.0 /100 | #2 | Exceptional 79.5% |
| Somalis | 100.0 /100 | #3 | Exceptional 79.3% |
| Alaskan Athabascans | 100.0 /100 | #4 | Exceptional 79.1% |
| Aleuts | 100.0 /100 | #5 | Exceptional 79.0% |
| Danes | 100.0 /100 | #6 | Exceptional 79.0% |
| Luxembourgers | 100.0 /100 | #7 | Exceptional 79.0% |
| Immigrants | Cabo Verde | 100.0 /100 | #8 | Exceptional 78.9% |
| Swedes | 100.0 /100 | #9 | Exceptional 78.8% |
| Slovenes | 100.0 /100 | #10 | Exceptional 78.7% |
| Finns | 100.0 /100 | #11 | Exceptional 78.7% |
| Germans | 100.0 /100 | #12 | Exceptional 78.6% |
| Scandinavians | 100.0 /100 | #13 | Exceptional 78.5% |
| Czechs | 100.0 /100 | #14 | Exceptional 78.5% |
| Sudanese | 100.0 /100 | #15 | Exceptional 78.4% |