Chippewa vs Russian Median Earnings
COMPARE
Chippewa
Russian
Median Earnings
Median Earnings Comparison
Chippewa
Russians
$40,287
MEDIAN EARNINGS
0.0/ 100
METRIC RATING
312th/ 347
METRIC RANK
$53,334
MEDIAN EARNINGS
100.0/ 100
METRIC RATING
31st/ 347
METRIC RANK
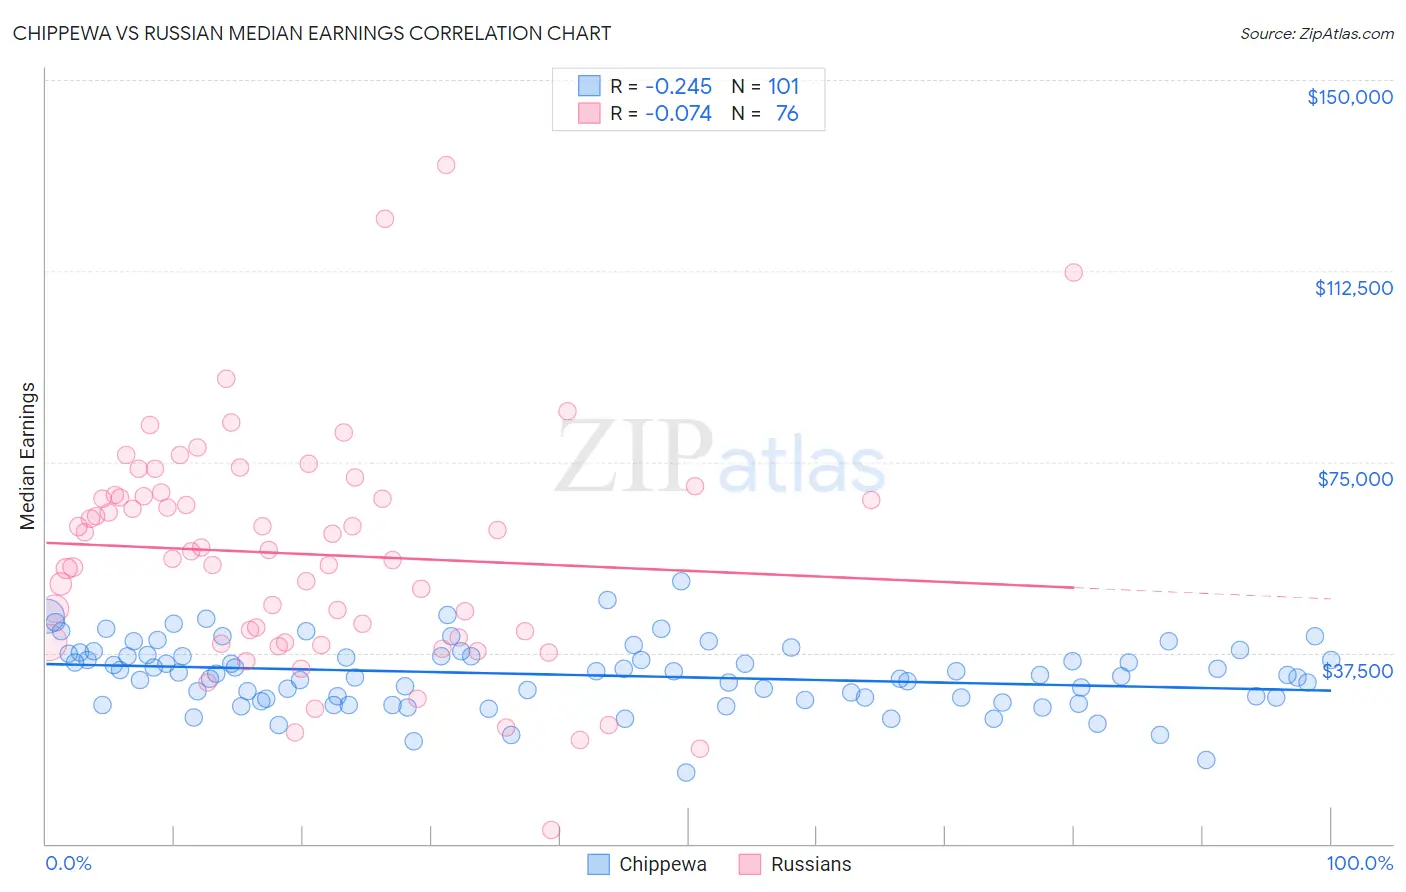
Chippewa vs Russian Median Earnings Correlation Chart
The statistical analysis conducted on geographies consisting of 215,041,296 people shows a weak negative correlation between the proportion of Chippewa and median earnings in the United States with a correlation coefficient (R) of -0.245 and weighted average of $40,287. Similarly, the statistical analysis conducted on geographies consisting of 512,155,619 people shows a slight negative correlation between the proportion of Russians and median earnings in the United States with a correlation coefficient (R) of -0.074 and weighted average of $53,334, a difference of 32.4%.
Median Earnings Correlation Summary
| Measurement | Chippewa | Russian |
| Minimum | $14,000 | $2,766 |
| Maximum | $51,563 | $133,235 |
| Range | $37,563 | $130,469 |
| Mean | $33,174 | $56,899 |
| Median | $33,342 | $57,547 |
| Interquartile 25% (IQ1) | $28,488 | $40,132 |
| Interquartile 75% (IQ3) | $37,270 | $68,448 |
| Interquartile Range (IQR) | $8,782 | $28,315 |
| Standard Deviation (Sample) | $6,612 | $22,580 |
| Standard Deviation (Population) | $6,579 | $22,431 |
Similar Demographics by Median Earnings
Demographics Similar to Chippewa by Median Earnings
In terms of median earnings, the demographic groups most similar to Chippewa are Hispanic or Latino ($40,288, a difference of 0.0%), Choctaw ($40,270, a difference of 0.040%), Cheyenne ($40,233, a difference of 0.13%), Seminole ($40,233, a difference of 0.13%), and Immigrants from Honduras ($40,195, a difference of 0.23%).
| Demographics | Rating | Rank | Median Earnings |
| Chickasaw | 0.0 /100 | #305 | Tragic $40,672 |
| Yaqui | 0.0 /100 | #306 | Tragic $40,647 |
| Hondurans | 0.0 /100 | #307 | Tragic $40,638 |
| Cubans | 0.0 /100 | #308 | Tragic $40,619 |
| Immigrants | Haiti | 0.0 /100 | #309 | Tragic $40,550 |
| Apache | 0.0 /100 | #310 | Tragic $40,388 |
| Hispanics or Latinos | 0.0 /100 | #311 | Tragic $40,288 |
| Chippewa | 0.0 /100 | #312 | Tragic $40,287 |
| Choctaw | 0.0 /100 | #313 | Tragic $40,270 |
| Cheyenne | 0.0 /100 | #314 | Tragic $40,233 |
| Seminole | 0.0 /100 | #315 | Tragic $40,233 |
| Immigrants | Honduras | 0.0 /100 | #316 | Tragic $40,195 |
| Fijians | 0.0 /100 | #317 | Tragic $40,193 |
| Dutch West Indians | 0.0 /100 | #318 | Tragic $40,107 |
| Blacks/African Americans | 0.0 /100 | #319 | Tragic $40,085 |
Demographics Similar to Russians by Median Earnings
In terms of median earnings, the demographic groups most similar to Russians are Immigrants from Asia ($53,310, a difference of 0.040%), Cambodian ($53,386, a difference of 0.10%), Immigrants from Greece ($53,282, a difference of 0.10%), Immigrants from Sri Lanka ($53,268, a difference of 0.12%), and Immigrants from Russia ($53,457, a difference of 0.23%).
| Demographics | Rating | Rank | Median Earnings |
| Soviet Union | 100.0 /100 | #24 | Exceptional $54,290 |
| Turks | 100.0 /100 | #25 | Exceptional $53,919 |
| Immigrants | Northern Europe | 100.0 /100 | #26 | Exceptional $53,872 |
| Asians | 100.0 /100 | #27 | Exceptional $53,690 |
| Immigrants | France | 100.0 /100 | #28 | Exceptional $53,490 |
| Immigrants | Russia | 100.0 /100 | #29 | Exceptional $53,457 |
| Cambodians | 100.0 /100 | #30 | Exceptional $53,386 |
| Russians | 100.0 /100 | #31 | Exceptional $53,334 |
| Immigrants | Asia | 100.0 /100 | #32 | Exceptional $53,310 |
| Immigrants | Greece | 100.0 /100 | #33 | Exceptional $53,282 |
| Immigrants | Sri Lanka | 100.0 /100 | #34 | Exceptional $53,268 |
| Immigrants | Switzerland | 100.0 /100 | #35 | Exceptional $53,211 |
| Immigrants | Denmark | 100.0 /100 | #36 | Exceptional $53,186 |
| Immigrants | Belarus | 100.0 /100 | #37 | Exceptional $53,043 |
| Latvians | 100.0 /100 | #38 | Exceptional $53,001 |