Chippewa vs Immigrants from Cambodia Median Earnings
COMPARE
Chippewa
Immigrants from Cambodia
Median Earnings
Median Earnings Comparison
Chippewa
Immigrants from Cambodia
$40,287
MEDIAN EARNINGS
0.0/ 100
METRIC RATING
312th/ 347
METRIC RANK
$45,090
MEDIAN EARNINGS
13.2/ 100
METRIC RATING
225th/ 347
METRIC RANK
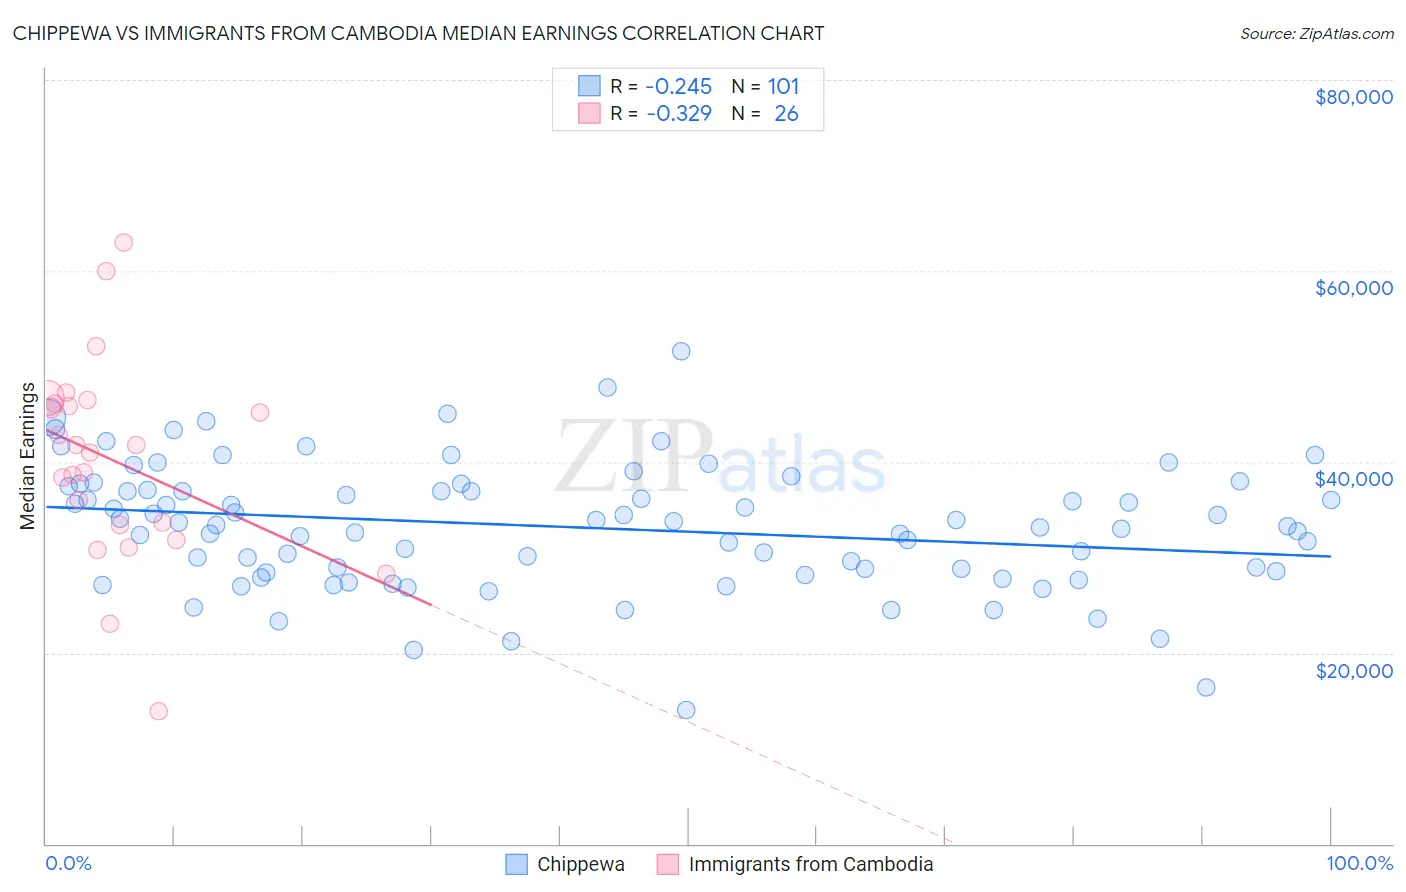
Chippewa vs Immigrants from Cambodia Median Earnings Correlation Chart
The statistical analysis conducted on geographies consisting of 215,041,296 people shows a weak negative correlation between the proportion of Chippewa and median earnings in the United States with a correlation coefficient (R) of -0.245 and weighted average of $40,287. Similarly, the statistical analysis conducted on geographies consisting of 205,155,765 people shows a mild negative correlation between the proportion of Immigrants from Cambodia and median earnings in the United States with a correlation coefficient (R) of -0.329 and weighted average of $45,090, a difference of 11.9%.
Median Earnings Correlation Summary
| Measurement | Chippewa | Immigrants from Cambodia |
| Minimum | $14,000 | $13,852 |
| Maximum | $51,563 | $62,969 |
| Range | $37,563 | $49,117 |
| Mean | $33,174 | $40,126 |
| Median | $33,342 | $41,377 |
| Interquartile 25% (IQ1) | $28,488 | $33,437 |
| Interquartile 75% (IQ3) | $37,270 | $46,102 |
| Interquartile Range (IQR) | $8,782 | $12,665 |
| Standard Deviation (Sample) | $6,612 | $10,590 |
| Standard Deviation (Population) | $6,579 | $10,384 |
Similar Demographics by Median Earnings
Demographics Similar to Chippewa by Median Earnings
In terms of median earnings, the demographic groups most similar to Chippewa are Hispanic or Latino ($40,288, a difference of 0.0%), Choctaw ($40,270, a difference of 0.040%), Cheyenne ($40,233, a difference of 0.13%), Seminole ($40,233, a difference of 0.13%), and Immigrants from Honduras ($40,195, a difference of 0.23%).
| Demographics | Rating | Rank | Median Earnings |
| Chickasaw | 0.0 /100 | #305 | Tragic $40,672 |
| Yaqui | 0.0 /100 | #306 | Tragic $40,647 |
| Hondurans | 0.0 /100 | #307 | Tragic $40,638 |
| Cubans | 0.0 /100 | #308 | Tragic $40,619 |
| Immigrants | Haiti | 0.0 /100 | #309 | Tragic $40,550 |
| Apache | 0.0 /100 | #310 | Tragic $40,388 |
| Hispanics or Latinos | 0.0 /100 | #311 | Tragic $40,288 |
| Chippewa | 0.0 /100 | #312 | Tragic $40,287 |
| Choctaw | 0.0 /100 | #313 | Tragic $40,270 |
| Cheyenne | 0.0 /100 | #314 | Tragic $40,233 |
| Seminole | 0.0 /100 | #315 | Tragic $40,233 |
| Immigrants | Honduras | 0.0 /100 | #316 | Tragic $40,195 |
| Fijians | 0.0 /100 | #317 | Tragic $40,193 |
| Dutch West Indians | 0.0 /100 | #318 | Tragic $40,107 |
| Blacks/African Americans | 0.0 /100 | #319 | Tragic $40,085 |
Demographics Similar to Immigrants from Cambodia by Median Earnings
In terms of median earnings, the demographic groups most similar to Immigrants from Cambodia are West Indian ($45,132, a difference of 0.090%), Immigrants from Nigeria ($45,030, a difference of 0.13%), Native Hawaiian ($45,027, a difference of 0.14%), Immigrants from Iraq ($44,988, a difference of 0.22%), and Immigrants from Panama ($45,198, a difference of 0.24%).
| Demographics | Rating | Rank | Median Earnings |
| Spanish | 19.7 /100 | #218 | Poor $45,432 |
| Dutch | 18.4 /100 | #219 | Poor $45,370 |
| Ecuadorians | 15.3 /100 | #220 | Poor $45,214 |
| Immigrants | Guyana | 15.1 /100 | #221 | Poor $45,204 |
| Immigrants | Panama | 15.0 /100 | #222 | Poor $45,198 |
| Whites/Caucasians | 15.0 /100 | #223 | Poor $45,197 |
| West Indians | 13.9 /100 | #224 | Poor $45,132 |
| Immigrants | Cambodia | 13.2 /100 | #225 | Poor $45,090 |
| Immigrants | Nigeria | 12.2 /100 | #226 | Poor $45,030 |
| Native Hawaiians | 12.2 /100 | #227 | Poor $45,027 |
| Immigrants | Iraq | 11.6 /100 | #228 | Poor $44,988 |
| Scotch-Irish | 10.7 /100 | #229 | Poor $44,924 |
| Immigrants | Western Africa | 10.3 /100 | #230 | Poor $44,893 |
| Japanese | 9.5 /100 | #231 | Tragic $44,825 |
| Delaware | 9.0 /100 | #232 | Tragic $44,783 |