Chippewa vs Immigrants from Honduras Median Earnings
COMPARE
Chippewa
Immigrants from Honduras
Median Earnings
Median Earnings Comparison
Chippewa
Immigrants from Honduras
$40,287
MEDIAN EARNINGS
0.0/ 100
METRIC RATING
312th/ 347
METRIC RANK
$40,195
MEDIAN EARNINGS
0.0/ 100
METRIC RATING
316th/ 347
METRIC RANK
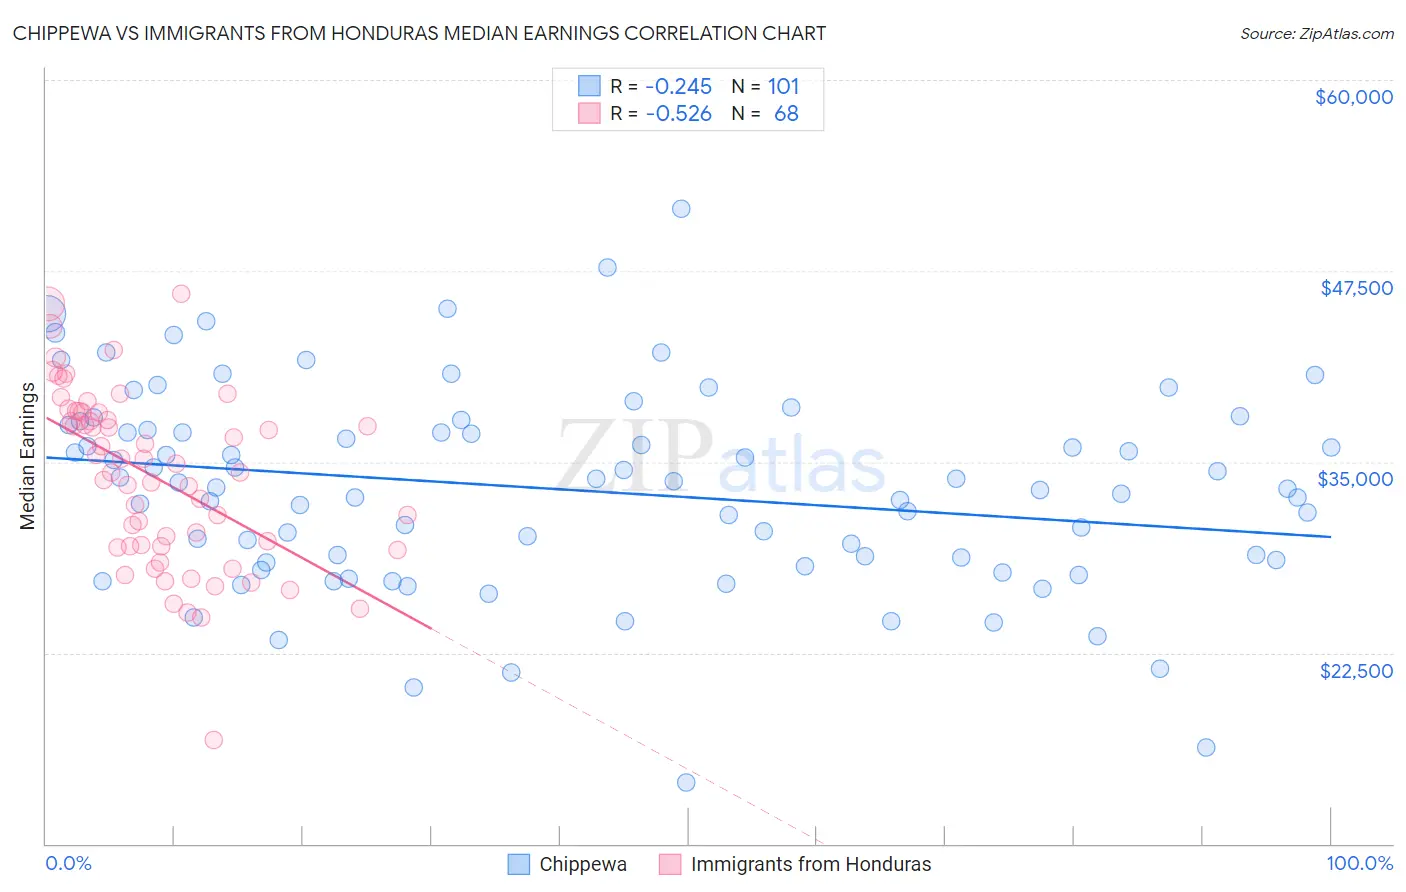
Chippewa vs Immigrants from Honduras Median Earnings Correlation Chart
The statistical analysis conducted on geographies consisting of 215,041,296 people shows a weak negative correlation between the proportion of Chippewa and median earnings in the United States with a correlation coefficient (R) of -0.245 and weighted average of $40,287. Similarly, the statistical analysis conducted on geographies consisting of 322,602,999 people shows a substantial negative correlation between the proportion of Immigrants from Honduras and median earnings in the United States with a correlation coefficient (R) of -0.526 and weighted average of $40,195, a difference of 0.23%.
Median Earnings Correlation Summary
| Measurement | Chippewa | Immigrants from Honduras |
| Minimum | $14,000 | $16,824 |
| Maximum | $51,563 | $45,968 |
| Range | $37,563 | $29,144 |
| Mean | $33,174 | $34,003 |
| Median | $33,342 | $34,587 |
| Interquartile 25% (IQ1) | $28,488 | $29,475 |
| Interquartile 75% (IQ3) | $37,270 | $38,232 |
| Interquartile Range (IQR) | $8,782 | $8,757 |
| Standard Deviation (Sample) | $6,612 | $5,716 |
| Standard Deviation (Population) | $6,579 | $5,674 |
Demographics Similar to Chippewa and Immigrants from Honduras by Median Earnings
In terms of median earnings, the demographic groups most similar to Chippewa are Hispanic or Latino ($40,288, a difference of 0.0%), Choctaw ($40,270, a difference of 0.040%), Cheyenne ($40,233, a difference of 0.13%), Seminole ($40,233, a difference of 0.13%), and Fijian ($40,193, a difference of 0.23%). Similarly, the demographic groups most similar to Immigrants from Honduras are Fijian ($40,193, a difference of 0.0%), Seminole ($40,233, a difference of 0.090%), Cheyenne ($40,233, a difference of 0.10%), Choctaw ($40,270, a difference of 0.19%), and Dutch West Indian ($40,107, a difference of 0.22%).
| Demographics | Rating | Rank | Median Earnings |
| Immigrants | Guatemala | 0.0 /100 | #304 | Tragic $40,851 |
| Chickasaw | 0.0 /100 | #305 | Tragic $40,672 |
| Yaqui | 0.0 /100 | #306 | Tragic $40,647 |
| Hondurans | 0.0 /100 | #307 | Tragic $40,638 |
| Cubans | 0.0 /100 | #308 | Tragic $40,619 |
| Immigrants | Haiti | 0.0 /100 | #309 | Tragic $40,550 |
| Apache | 0.0 /100 | #310 | Tragic $40,388 |
| Hispanics or Latinos | 0.0 /100 | #311 | Tragic $40,288 |
| Chippewa | 0.0 /100 | #312 | Tragic $40,287 |
| Choctaw | 0.0 /100 | #313 | Tragic $40,270 |
| Cheyenne | 0.0 /100 | #314 | Tragic $40,233 |
| Seminole | 0.0 /100 | #315 | Tragic $40,233 |
| Immigrants | Honduras | 0.0 /100 | #316 | Tragic $40,195 |
| Fijians | 0.0 /100 | #317 | Tragic $40,193 |
| Dutch West Indians | 0.0 /100 | #318 | Tragic $40,107 |
| Blacks/African Americans | 0.0 /100 | #319 | Tragic $40,085 |
| Immigrants | Bahamas | 0.0 /100 | #320 | Tragic $39,861 |
| Mexicans | 0.0 /100 | #321 | Tragic $39,834 |
| Immigrants | Central America | 0.0 /100 | #322 | Tragic $39,762 |
| Bahamians | 0.0 /100 | #323 | Tragic $39,735 |
| Ottawa | 0.0 /100 | #324 | Tragic $39,721 |