Chippewa vs Scandinavian Median Earnings
COMPARE
Chippewa
Scandinavian
Median Earnings
Median Earnings Comparison
Chippewa
Scandinavians
$40,287
MEDIAN EARNINGS
0.0/ 100
METRIC RATING
312th/ 347
METRIC RANK
$46,433
MEDIAN EARNINGS
50.0/ 100
METRIC RATING
174th/ 347
METRIC RANK
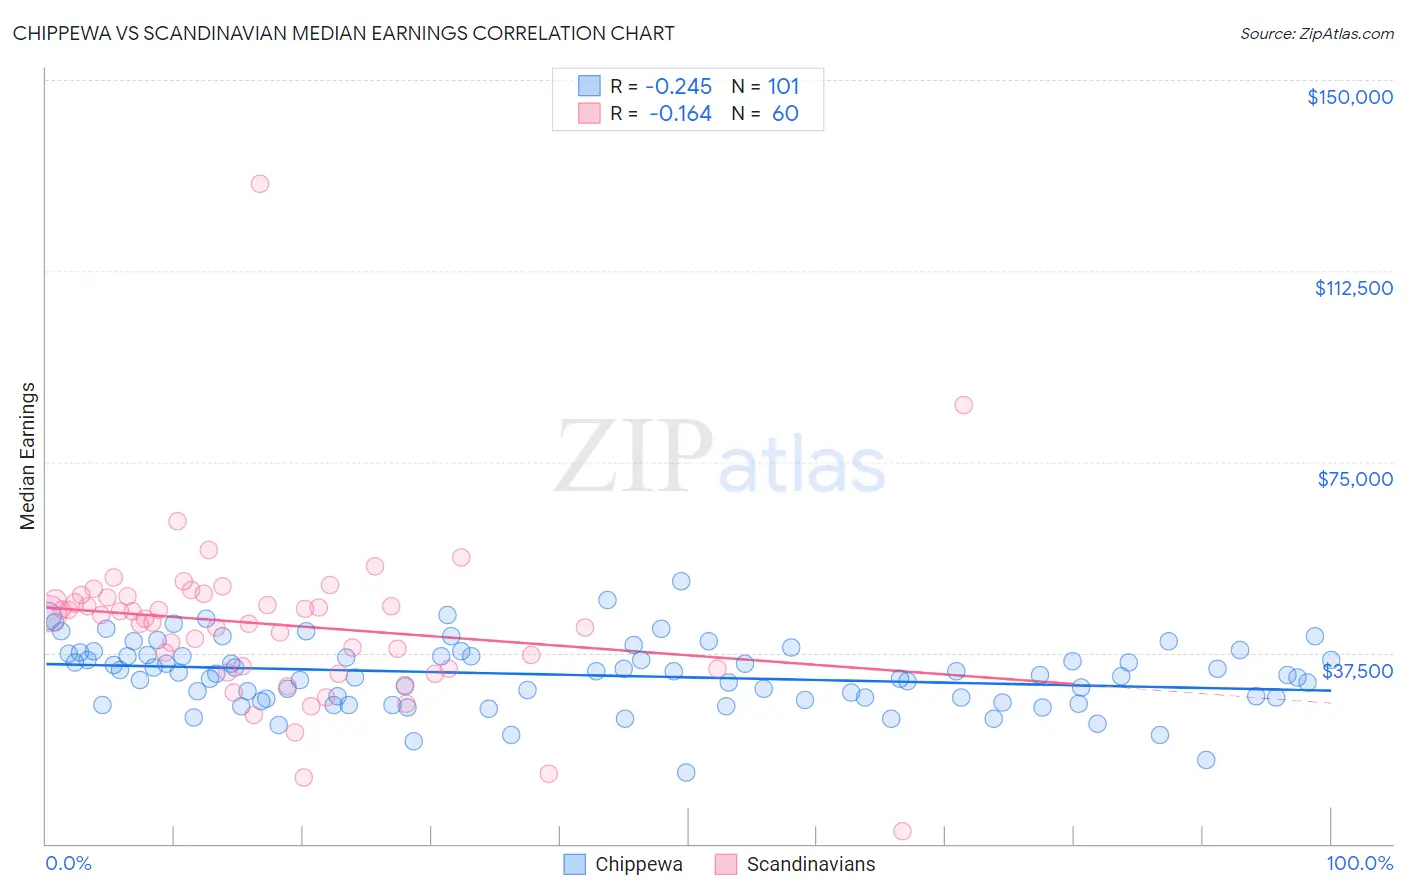
Chippewa vs Scandinavian Median Earnings Correlation Chart
The statistical analysis conducted on geographies consisting of 215,041,296 people shows a weak negative correlation between the proportion of Chippewa and median earnings in the United States with a correlation coefficient (R) of -0.245 and weighted average of $40,287. Similarly, the statistical analysis conducted on geographies consisting of 472,554,301 people shows a poor negative correlation between the proportion of Scandinavians and median earnings in the United States with a correlation coefficient (R) of -0.164 and weighted average of $46,433, a difference of 15.3%.
Median Earnings Correlation Summary
| Measurement | Chippewa | Scandinavian |
| Minimum | $14,000 | $2,499 |
| Maximum | $51,563 | $129,652 |
| Range | $37,563 | $127,153 |
| Mean | $33,174 | $43,051 |
| Median | $33,342 | $44,555 |
| Interquartile 25% (IQ1) | $28,488 | $34,442 |
| Interquartile 75% (IQ3) | $37,270 | $48,536 |
| Interquartile Range (IQR) | $8,782 | $14,094 |
| Standard Deviation (Sample) | $6,612 | $16,928 |
| Standard Deviation (Population) | $6,579 | $16,786 |
Similar Demographics by Median Earnings
Demographics Similar to Chippewa by Median Earnings
In terms of median earnings, the demographic groups most similar to Chippewa are Hispanic or Latino ($40,288, a difference of 0.0%), Choctaw ($40,270, a difference of 0.040%), Cheyenne ($40,233, a difference of 0.13%), Seminole ($40,233, a difference of 0.13%), and Immigrants from Honduras ($40,195, a difference of 0.23%).
| Demographics | Rating | Rank | Median Earnings |
| Chickasaw | 0.0 /100 | #305 | Tragic $40,672 |
| Yaqui | 0.0 /100 | #306 | Tragic $40,647 |
| Hondurans | 0.0 /100 | #307 | Tragic $40,638 |
| Cubans | 0.0 /100 | #308 | Tragic $40,619 |
| Immigrants | Haiti | 0.0 /100 | #309 | Tragic $40,550 |
| Apache | 0.0 /100 | #310 | Tragic $40,388 |
| Hispanics or Latinos | 0.0 /100 | #311 | Tragic $40,288 |
| Chippewa | 0.0 /100 | #312 | Tragic $40,287 |
| Choctaw | 0.0 /100 | #313 | Tragic $40,270 |
| Cheyenne | 0.0 /100 | #314 | Tragic $40,233 |
| Seminole | 0.0 /100 | #315 | Tragic $40,233 |
| Immigrants | Honduras | 0.0 /100 | #316 | Tragic $40,195 |
| Fijians | 0.0 /100 | #317 | Tragic $40,193 |
| Dutch West Indians | 0.0 /100 | #318 | Tragic $40,107 |
| Blacks/African Americans | 0.0 /100 | #319 | Tragic $40,085 |
Demographics Similar to Scandinavians by Median Earnings
In terms of median earnings, the demographic groups most similar to Scandinavians are Ghanaian ($46,440, a difference of 0.020%), Scottish ($46,463, a difference of 0.060%), Kenyan ($46,462, a difference of 0.060%), Basque ($46,399, a difference of 0.070%), and Danish ($46,392, a difference of 0.090%).
| Demographics | Rating | Rank | Median Earnings |
| Costa Ricans | 57.4 /100 | #167 | Average $46,645 |
| Immigrants | Africa | 54.6 /100 | #168 | Average $46,564 |
| Immigrants | South America | 54.0 /100 | #169 | Average $46,548 |
| Immigrants | Immigrants | 51.6 /100 | #170 | Average $46,478 |
| Scottish | 51.1 /100 | #171 | Average $46,463 |
| Kenyans | 51.0 /100 | #172 | Average $46,462 |
| Ghanaians | 50.3 /100 | #173 | Average $46,440 |
| Scandinavians | 50.0 /100 | #174 | Average $46,433 |
| Basques | 48.8 /100 | #175 | Average $46,399 |
| Danes | 48.6 /100 | #176 | Average $46,392 |
| Belgians | 48.0 /100 | #177 | Average $46,375 |
| Colombians | 47.1 /100 | #178 | Average $46,349 |
| English | 46.5 /100 | #179 | Average $46,334 |
| Puget Sound Salish | 46.5 /100 | #180 | Average $46,333 |
| Immigrants | Cameroon | 46.4 /100 | #181 | Average $46,329 |