Immigrants from Albania vs Immigrants from Somalia Median Earnings
COMPARE
Immigrants from Albania
Immigrants from Somalia
Median Earnings
Median Earnings Comparison
Immigrants from Albania
Immigrants from Somalia
$49,377
MEDIAN EARNINGS
98.4/ 100
METRIC RATING
106th/ 347
METRIC RANK
$43,100
MEDIAN EARNINGS
0.9/ 100
METRIC RATING
260th/ 347
METRIC RANK
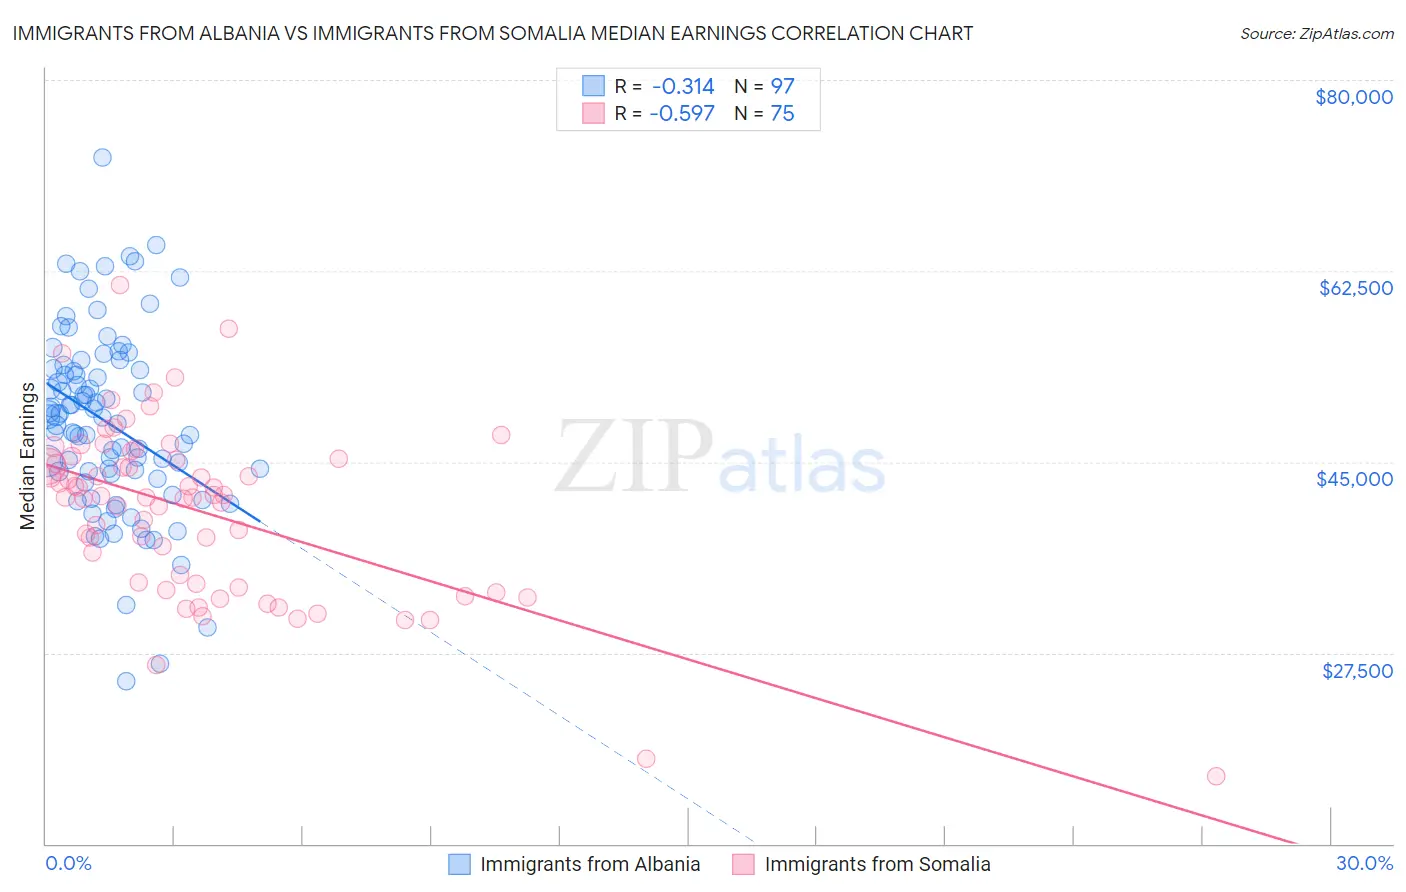
Immigrants from Albania vs Immigrants from Somalia Median Earnings Correlation Chart
The statistical analysis conducted on geographies consisting of 119,374,526 people shows a mild negative correlation between the proportion of Immigrants from Albania and median earnings in the United States with a correlation coefficient (R) of -0.314 and weighted average of $49,377. Similarly, the statistical analysis conducted on geographies consisting of 92,110,965 people shows a substantial negative correlation between the proportion of Immigrants from Somalia and median earnings in the United States with a correlation coefficient (R) of -0.597 and weighted average of $43,100, a difference of 14.6%.
Median Earnings Correlation Summary
| Measurement | Immigrants from Albania | Immigrants from Somalia |
| Minimum | $24,914 | $16,214 |
| Maximum | $72,899 | $61,239 |
| Range | $47,985 | $45,025 |
| Mean | $48,556 | $40,509 |
| Median | $49,058 | $41,780 |
| Interquartile 25% (IQ1) | $43,717 | $33,809 |
| Interquartile 75% (IQ3) | $53,495 | $45,326 |
| Interquartile Range (IQR) | $9,778 | $11,517 |
| Standard Deviation (Sample) | $8,407 | $7,944 |
| Standard Deviation (Population) | $8,364 | $7,891 |
Similar Demographics by Median Earnings
Demographics Similar to Immigrants from Albania by Median Earnings
In terms of median earnings, the demographic groups most similar to Immigrants from Albania are Immigrants from Western Asia ($49,389, a difference of 0.020%), Immigrants from Morocco ($49,368, a difference of 0.020%), Immigrants from Brazil ($49,463, a difference of 0.17%), Austrian ($49,501, a difference of 0.25%), and Palestinian ($49,209, a difference of 0.34%).
| Demographics | Rating | Rank | Median Earnings |
| Immigrants | Afghanistan | 98.9 /100 | #99 | Exceptional $49,645 |
| Immigrants | Poland | 98.9 /100 | #100 | Exceptional $49,633 |
| Jordanians | 98.9 /100 | #101 | Exceptional $49,632 |
| Ethiopians | 98.8 /100 | #102 | Exceptional $49,572 |
| Austrians | 98.7 /100 | #103 | Exceptional $49,501 |
| Immigrants | Brazil | 98.6 /100 | #104 | Exceptional $49,463 |
| Immigrants | Western Asia | 98.4 /100 | #105 | Exceptional $49,389 |
| Immigrants | Albania | 98.4 /100 | #106 | Exceptional $49,377 |
| Immigrants | Morocco | 98.4 /100 | #107 | Exceptional $49,368 |
| Palestinians | 98.0 /100 | #108 | Exceptional $49,209 |
| Syrians | 97.1 /100 | #109 | Exceptional $48,934 |
| Immigrants | Ethiopia | 97.1 /100 | #110 | Exceptional $48,924 |
| Immigrants | Zimbabwe | 97.0 /100 | #111 | Exceptional $48,913 |
| Northern Europeans | 96.9 /100 | #112 | Exceptional $48,887 |
| Immigrants | Kuwait | 96.8 /100 | #113 | Exceptional $48,861 |
Demographics Similar to Immigrants from Somalia by Median Earnings
In terms of median earnings, the demographic groups most similar to Immigrants from Somalia are Immigrants from Jamaica ($43,026, a difference of 0.17%), Nicaraguan ($43,026, a difference of 0.17%), German Russian ($43,200, a difference of 0.23%), Inupiat ($43,000, a difference of 0.23%), and Immigrants from Liberia ($42,923, a difference of 0.41%).
| Demographics | Rating | Rank | Median Earnings |
| Somalis | 1.8 /100 | #253 | Tragic $43,567 |
| Liberians | 1.7 /100 | #254 | Tragic $43,536 |
| Immigrants | Middle Africa | 1.4 /100 | #255 | Tragic $43,416 |
| Alaskan Athabascans | 1.4 /100 | #256 | Tragic $43,393 |
| Jamaicans | 1.3 /100 | #257 | Tragic $43,343 |
| French American Indians | 1.3 /100 | #258 | Tragic $43,333 |
| German Russians | 1.1 /100 | #259 | Tragic $43,200 |
| Immigrants | Somalia | 0.9 /100 | #260 | Tragic $43,100 |
| Immigrants | Jamaica | 0.8 /100 | #261 | Tragic $43,026 |
| Nicaraguans | 0.8 /100 | #262 | Tragic $43,026 |
| Inupiat | 0.8 /100 | #263 | Tragic $43,000 |
| Immigrants | Liberia | 0.7 /100 | #264 | Tragic $42,923 |
| Salvadorans | 0.7 /100 | #265 | Tragic $42,912 |
| Immigrants | Laos | 0.7 /100 | #266 | Tragic $42,884 |
| Cree | 0.6 /100 | #267 | Tragic $42,777 |