Chippewa vs Immigrants from Philippines Median Earnings
COMPARE
Chippewa
Immigrants from Philippines
Median Earnings
Median Earnings Comparison
Chippewa
Immigrants from Philippines
$40,287
MEDIAN EARNINGS
0.0/ 100
METRIC RATING
312th/ 347
METRIC RANK
$48,266
MEDIAN EARNINGS
92.9/ 100
METRIC RATING
128th/ 347
METRIC RANK
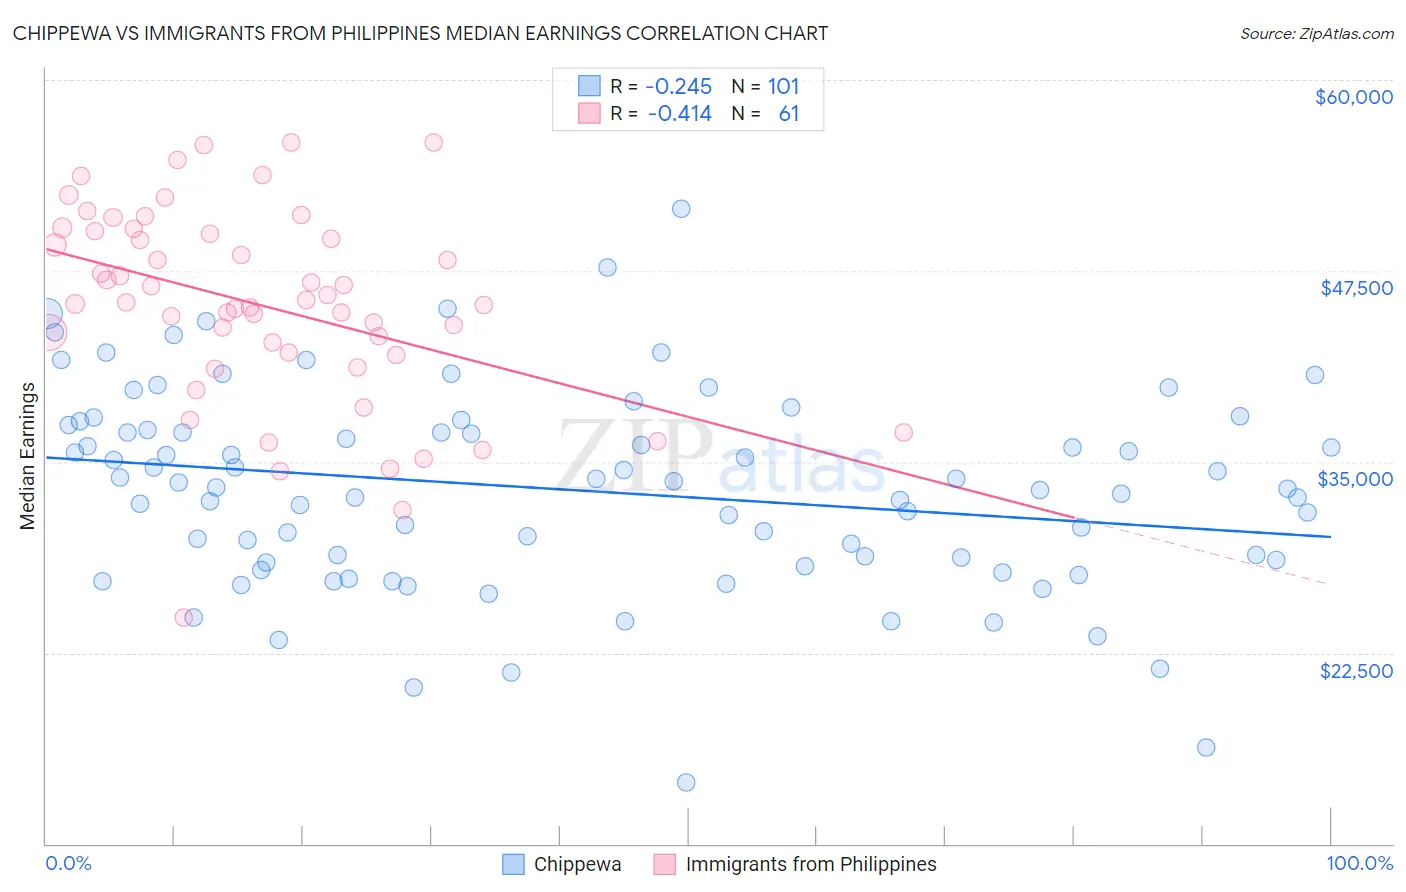
Chippewa vs Immigrants from Philippines Median Earnings Correlation Chart
The statistical analysis conducted on geographies consisting of 215,041,296 people shows a weak negative correlation between the proportion of Chippewa and median earnings in the United States with a correlation coefficient (R) of -0.245 and weighted average of $40,287. Similarly, the statistical analysis conducted on geographies consisting of 471,239,871 people shows a moderate negative correlation between the proportion of Immigrants from Philippines and median earnings in the United States with a correlation coefficient (R) of -0.414 and weighted average of $48,266, a difference of 19.8%.
Median Earnings Correlation Summary
| Measurement | Chippewa | Immigrants from Philippines |
| Minimum | $14,000 | $24,776 |
| Maximum | $51,563 | $55,949 |
| Range | $37,563 | $31,173 |
| Mean | $33,174 | $45,260 |
| Median | $33,342 | $45,398 |
| Interquartile 25% (IQ1) | $28,488 | $42,071 |
| Interquartile 75% (IQ3) | $37,270 | $50,000 |
| Interquartile Range (IQR) | $8,782 | $7,929 |
| Standard Deviation (Sample) | $6,612 | $6,408 |
| Standard Deviation (Population) | $6,579 | $6,355 |
Similar Demographics by Median Earnings
Demographics Similar to Chippewa by Median Earnings
In terms of median earnings, the demographic groups most similar to Chippewa are Hispanic or Latino ($40,288, a difference of 0.0%), Choctaw ($40,270, a difference of 0.040%), Cheyenne ($40,233, a difference of 0.13%), Seminole ($40,233, a difference of 0.13%), and Immigrants from Honduras ($40,195, a difference of 0.23%).
| Demographics | Rating | Rank | Median Earnings |
| Chickasaw | 0.0 /100 | #305 | Tragic $40,672 |
| Yaqui | 0.0 /100 | #306 | Tragic $40,647 |
| Hondurans | 0.0 /100 | #307 | Tragic $40,638 |
| Cubans | 0.0 /100 | #308 | Tragic $40,619 |
| Immigrants | Haiti | 0.0 /100 | #309 | Tragic $40,550 |
| Apache | 0.0 /100 | #310 | Tragic $40,388 |
| Hispanics or Latinos | 0.0 /100 | #311 | Tragic $40,288 |
| Chippewa | 0.0 /100 | #312 | Tragic $40,287 |
| Choctaw | 0.0 /100 | #313 | Tragic $40,270 |
| Cheyenne | 0.0 /100 | #314 | Tragic $40,233 |
| Seminole | 0.0 /100 | #315 | Tragic $40,233 |
| Immigrants | Honduras | 0.0 /100 | #316 | Tragic $40,195 |
| Fijians | 0.0 /100 | #317 | Tragic $40,193 |
| Dutch West Indians | 0.0 /100 | #318 | Tragic $40,107 |
| Blacks/African Americans | 0.0 /100 | #319 | Tragic $40,085 |
Demographics Similar to Immigrants from Philippines by Median Earnings
In terms of median earnings, the demographic groups most similar to Immigrants from Philippines are Pakistani ($48,254, a difference of 0.020%), Sierra Leonean ($48,286, a difference of 0.040%), Immigrants from Fiji ($48,305, a difference of 0.080%), Assyrian/Chaldean/Syriac ($48,304, a difference of 0.080%), and Zimbabwean ($48,229, a difference of 0.080%).
| Demographics | Rating | Rank | Median Earnings |
| Arabs | 95.4 /100 | #121 | Exceptional $48,599 |
| Chileans | 94.8 /100 | #122 | Exceptional $48,504 |
| Immigrants | Syria | 93.9 /100 | #123 | Exceptional $48,375 |
| Brazilians | 93.7 /100 | #124 | Exceptional $48,356 |
| Immigrants | Fiji | 93.3 /100 | #125 | Exceptional $48,305 |
| Assyrians/Chaldeans/Syriacs | 93.3 /100 | #126 | Exceptional $48,304 |
| Sierra Leoneans | 93.1 /100 | #127 | Exceptional $48,286 |
| Immigrants | Philippines | 92.9 /100 | #128 | Exceptional $48,266 |
| Pakistanis | 92.8 /100 | #129 | Exceptional $48,254 |
| Zimbabweans | 92.6 /100 | #130 | Exceptional $48,229 |
| Lebanese | 92.5 /100 | #131 | Exceptional $48,226 |
| British | 92.2 /100 | #132 | Exceptional $48,189 |
| Immigrants | Uganda | 90.5 /100 | #133 | Exceptional $48,041 |
| Sri Lankans | 90.5 /100 | #134 | Exceptional $48,040 |
| Portuguese | 90.4 /100 | #135 | Exceptional $48,032 |