Chinese vs Spanish Median Female Earnings
COMPARE
Chinese
Spanish
Median Female Earnings
Median Female Earnings Comparison
Chinese
Spanish
$41,461
MEDIAN FEMALE EARNINGS
97.5/ 100
METRIC RATING
109th/ 347
METRIC RANK
$38,098
MEDIAN FEMALE EARNINGS
3.5/ 100
METRIC RATING
241st/ 347
METRIC RANK
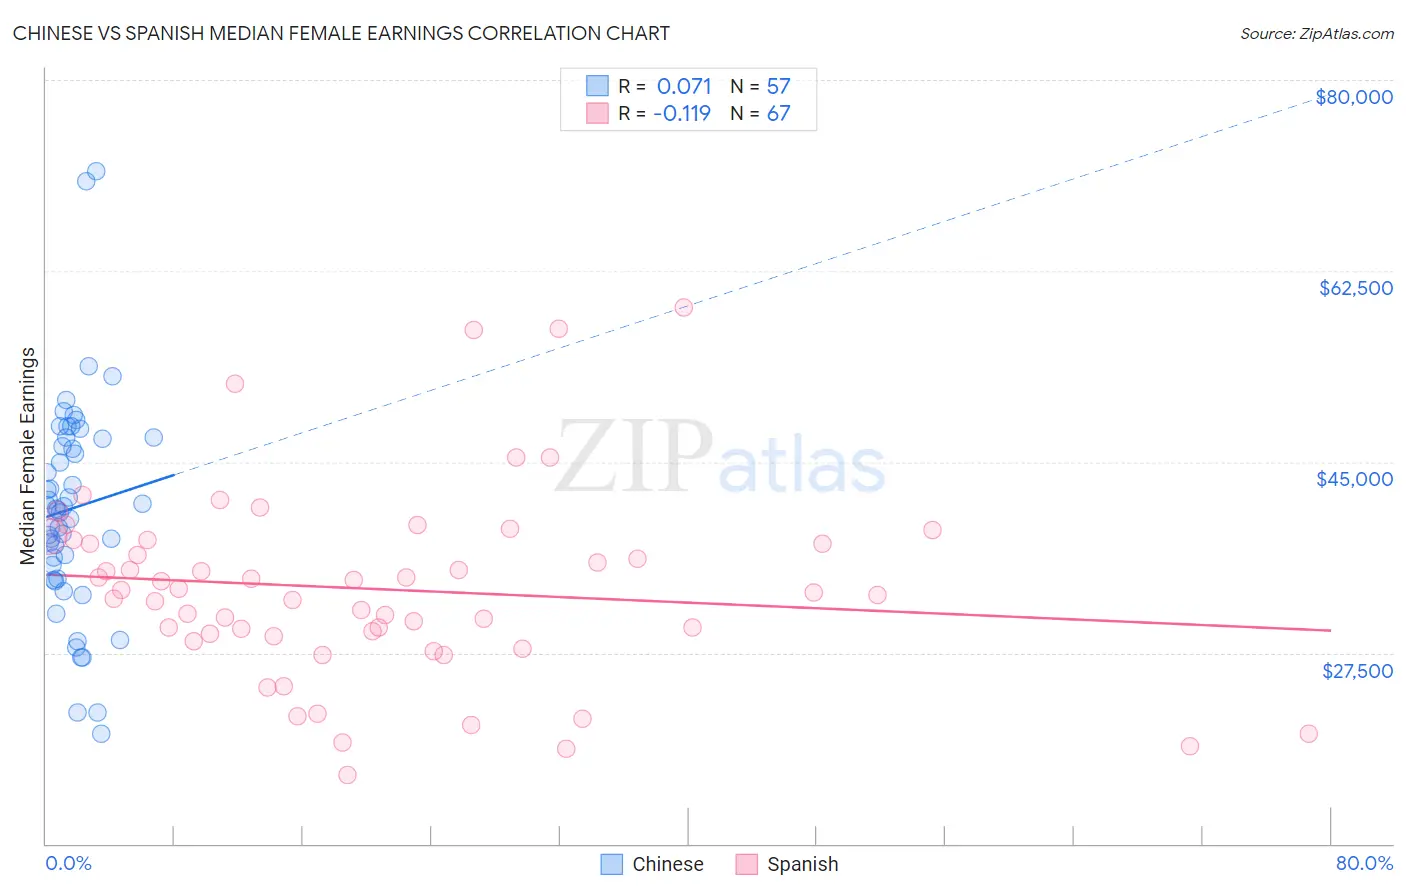
Chinese vs Spanish Median Female Earnings Correlation Chart
The statistical analysis conducted on geographies consisting of 64,808,152 people shows a slight positive correlation between the proportion of Chinese and median female earnings in the United States with a correlation coefficient (R) of 0.071 and weighted average of $41,461. Similarly, the statistical analysis conducted on geographies consisting of 421,897,645 people shows a poor negative correlation between the proportion of Spanish and median female earnings in the United States with a correlation coefficient (R) of -0.119 and weighted average of $38,098, a difference of 8.8%.
Median Female Earnings Correlation Summary
| Measurement | Chinese | Spanish |
| Minimum | $20,043 | $16,357 |
| Maximum | $71,591 | $59,157 |
| Range | $51,548 | $42,800 |
| Mean | $40,727 | $33,351 |
| Median | $40,673 | $33,021 |
| Interquartile 25% (IQ1) | $34,915 | $29,054 |
| Interquartile 75% (IQ3) | $47,174 | $37,790 |
| Interquartile Range (IQR) | $12,258 | $8,737 |
| Standard Deviation (Sample) | $9,803 | $8,760 |
| Standard Deviation (Population) | $9,716 | $8,694 |
Similar Demographics by Median Female Earnings
Demographics Similar to Chinese by Median Female Earnings
In terms of median female earnings, the demographic groups most similar to Chinese are Jordanian ($41,464, a difference of 0.010%), Palestinian ($41,484, a difference of 0.050%), Immigrants from Eritrea ($41,485, a difference of 0.060%), Italian ($41,505, a difference of 0.10%), and Immigrants from Zimbabwe ($41,527, a difference of 0.16%).
| Demographics | Rating | Rank | Median Female Earnings |
| Immigrants | Poland | 98.2 /100 | #102 | Exceptional $41,630 |
| Immigrants | Argentina | 97.9 /100 | #103 | Exceptional $41,554 |
| Immigrants | Zimbabwe | 97.8 /100 | #104 | Exceptional $41,527 |
| Italians | 97.7 /100 | #105 | Exceptional $41,505 |
| Immigrants | Eritrea | 97.6 /100 | #106 | Exceptional $41,485 |
| Palestinians | 97.6 /100 | #107 | Exceptional $41,484 |
| Jordanians | 97.5 /100 | #108 | Exceptional $41,464 |
| Chinese | 97.5 /100 | #109 | Exceptional $41,461 |
| Immigrants | Western Asia | 97.0 /100 | #110 | Exceptional $41,375 |
| Immigrants | Canada | 97.0 /100 | #111 | Exceptional $41,373 |
| Immigrants | North America | 96.7 /100 | #112 | Exceptional $41,319 |
| Macedonians | 96.4 /100 | #113 | Exceptional $41,286 |
| Immigrants | England | 96.4 /100 | #114 | Exceptional $41,277 |
| Koreans | 96.4 /100 | #115 | Exceptional $41,276 |
| Immigrants | Brazil | 96.4 /100 | #116 | Exceptional $41,273 |
Demographics Similar to Spanish by Median Female Earnings
In terms of median female earnings, the demographic groups most similar to Spanish are Immigrants from Burma/Myanmar ($38,028, a difference of 0.18%), Finnish ($38,173, a difference of 0.20%), English ($38,196, a difference of 0.26%), Alaska Native ($38,202, a difference of 0.27%), and Immigrants from Cabo Verde ($38,208, a difference of 0.29%).
| Demographics | Rating | Rank | Median Female Earnings |
| Celtics | 5.0 /100 | #234 | Tragic $38,283 |
| Sudanese | 4.4 /100 | #235 | Tragic $38,215 |
| Liberians | 4.4 /100 | #236 | Tragic $38,215 |
| Immigrants | Cabo Verde | 4.3 /100 | #237 | Tragic $38,208 |
| Alaska Natives | 4.3 /100 | #238 | Tragic $38,202 |
| English | 4.2 /100 | #239 | Tragic $38,196 |
| Finns | 4.0 /100 | #240 | Tragic $38,173 |
| Spanish | 3.5 /100 | #241 | Tragic $38,098 |
| Immigrants | Burma/Myanmar | 3.0 /100 | #242 | Tragic $38,028 |
| Germans | 2.8 /100 | #243 | Tragic $37,986 |
| Immigrants | Liberia | 2.7 /100 | #244 | Tragic $37,970 |
| Immigrants | Middle Africa | 2.7 /100 | #245 | Tragic $37,965 |
| Delaware | 2.6 /100 | #246 | Tragic $37,964 |
| Immigrants | Somalia | 2.4 /100 | #247 | Tragic $37,914 |
| Alaskan Athabascans | 2.3 /100 | #248 | Tragic $37,905 |