Chinese vs Immigrants from Oceania Median Female Earnings
COMPARE
Chinese
Immigrants from Oceania
Median Female Earnings
Median Female Earnings Comparison
Chinese
Immigrants from Oceania
$41,461
MEDIAN FEMALE EARNINGS
97.5/ 100
METRIC RATING
109th/ 347
METRIC RANK
$40,297
MEDIAN FEMALE EARNINGS
77.6/ 100
METRIC RATING
154th/ 347
METRIC RANK
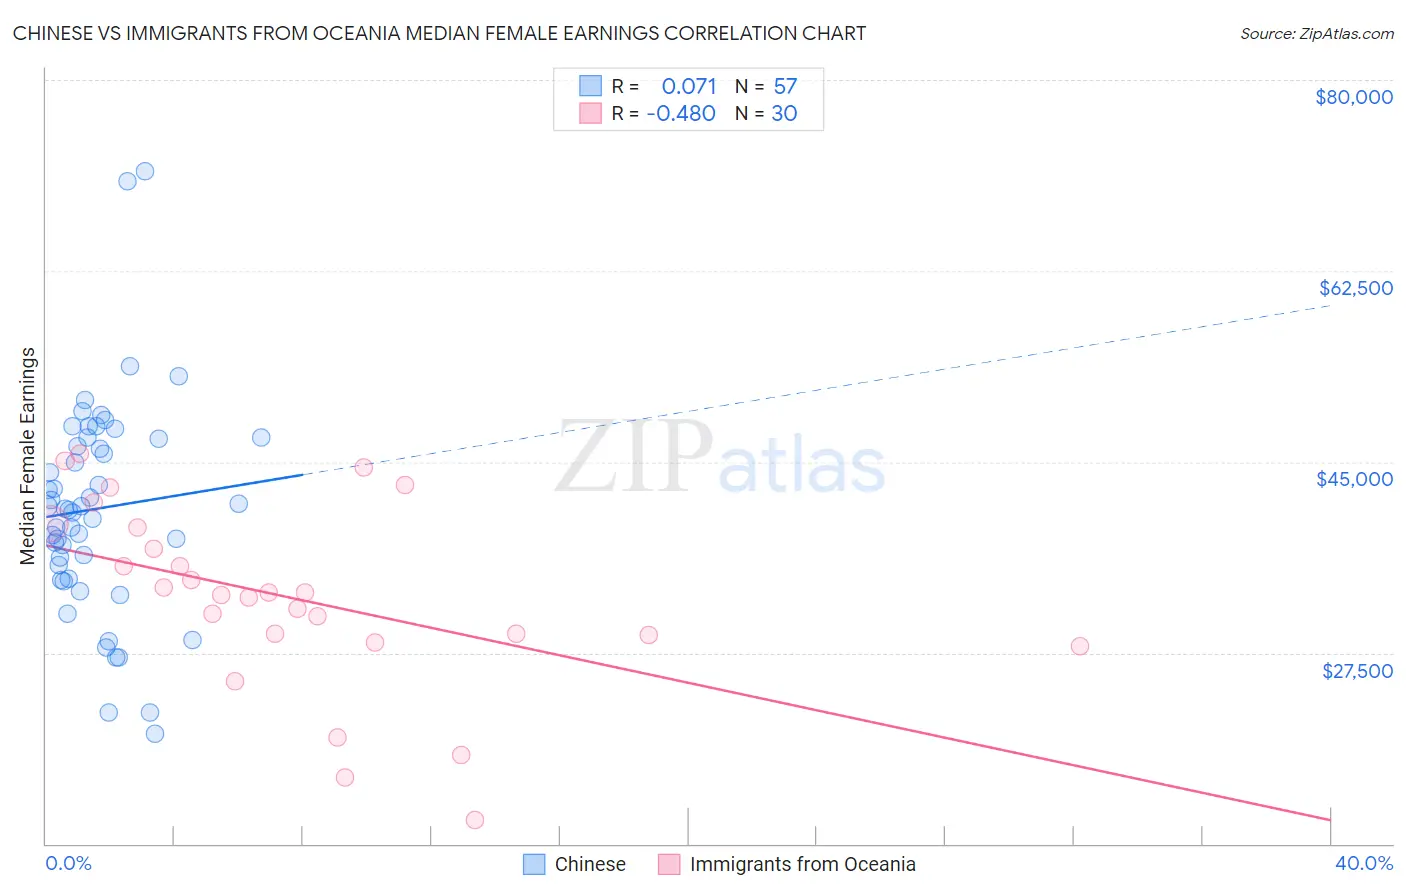
Chinese vs Immigrants from Oceania Median Female Earnings Correlation Chart
The statistical analysis conducted on geographies consisting of 64,808,152 people shows a slight positive correlation between the proportion of Chinese and median female earnings in the United States with a correlation coefficient (R) of 0.071 and weighted average of $41,461. Similarly, the statistical analysis conducted on geographies consisting of 305,406,455 people shows a moderate negative correlation between the proportion of Immigrants from Oceania and median female earnings in the United States with a correlation coefficient (R) of -0.480 and weighted average of $40,297, a difference of 2.9%.
Median Female Earnings Correlation Summary
| Measurement | Chinese | Immigrants from Oceania |
| Minimum | $20,043 | $12,128 |
| Maximum | $71,591 | $45,730 |
| Range | $51,548 | $33,602 |
| Mean | $40,727 | $32,539 |
| Median | $40,673 | $32,878 |
| Interquartile 25% (IQ1) | $34,915 | $29,179 |
| Interquartile 75% (IQ3) | $47,174 | $38,985 |
| Interquartile Range (IQR) | $12,258 | $9,806 |
| Standard Deviation (Sample) | $9,803 | $8,467 |
| Standard Deviation (Population) | $9,716 | $8,325 |
Similar Demographics by Median Female Earnings
Demographics Similar to Chinese by Median Female Earnings
In terms of median female earnings, the demographic groups most similar to Chinese are Jordanian ($41,464, a difference of 0.010%), Palestinian ($41,484, a difference of 0.050%), Immigrants from Eritrea ($41,485, a difference of 0.060%), Italian ($41,505, a difference of 0.10%), and Immigrants from Zimbabwe ($41,527, a difference of 0.16%).
| Demographics | Rating | Rank | Median Female Earnings |
| Immigrants | Poland | 98.2 /100 | #102 | Exceptional $41,630 |
| Immigrants | Argentina | 97.9 /100 | #103 | Exceptional $41,554 |
| Immigrants | Zimbabwe | 97.8 /100 | #104 | Exceptional $41,527 |
| Italians | 97.7 /100 | #105 | Exceptional $41,505 |
| Immigrants | Eritrea | 97.6 /100 | #106 | Exceptional $41,485 |
| Palestinians | 97.6 /100 | #107 | Exceptional $41,484 |
| Jordanians | 97.5 /100 | #108 | Exceptional $41,464 |
| Chinese | 97.5 /100 | #109 | Exceptional $41,461 |
| Immigrants | Western Asia | 97.0 /100 | #110 | Exceptional $41,375 |
| Immigrants | Canada | 97.0 /100 | #111 | Exceptional $41,373 |
| Immigrants | North America | 96.7 /100 | #112 | Exceptional $41,319 |
| Macedonians | 96.4 /100 | #113 | Exceptional $41,286 |
| Immigrants | England | 96.4 /100 | #114 | Exceptional $41,277 |
| Koreans | 96.4 /100 | #115 | Exceptional $41,276 |
| Immigrants | Brazil | 96.4 /100 | #116 | Exceptional $41,273 |
Demographics Similar to Immigrants from Oceania by Median Female Earnings
In terms of median female earnings, the demographic groups most similar to Immigrants from Oceania are British West Indian ($40,299, a difference of 0.010%), West Indian ($40,317, a difference of 0.050%), Immigrants from Africa ($40,257, a difference of 0.10%), Immigrants from Armenia ($40,340, a difference of 0.11%), and Immigrants from Cameroon ($40,354, a difference of 0.14%).
| Demographics | Rating | Rank | Median Female Earnings |
| Vietnamese | 80.4 /100 | #147 | Excellent $40,377 |
| Poles | 80.2 /100 | #148 | Excellent $40,371 |
| Immigrants | Cameroon | 79.7 /100 | #149 | Good $40,354 |
| Immigrants | Chile | 79.6 /100 | #150 | Good $40,353 |
| Immigrants | Armenia | 79.2 /100 | #151 | Good $40,340 |
| West Indians | 78.4 /100 | #152 | Good $40,317 |
| British West Indians | 77.7 /100 | #153 | Good $40,299 |
| Immigrants | Oceania | 77.6 /100 | #154 | Good $40,297 |
| Immigrants | Africa | 76.2 /100 | #155 | Good $40,257 |
| Peruvians | 75.3 /100 | #156 | Good $40,234 |
| Portuguese | 73.0 /100 | #157 | Good $40,177 |
| Immigrants | Senegal | 72.2 /100 | #158 | Good $40,157 |
| Immigrants | Vietnam | 72.0 /100 | #159 | Good $40,153 |
| Inupiat | 68.9 /100 | #160 | Good $40,080 |
| Alsatians | 68.0 /100 | #161 | Good $40,060 |