Chinese vs U.S. Virgin Islander Median Female Earnings
COMPARE
Chinese
U.S. Virgin Islander
Median Female Earnings
Median Female Earnings Comparison
Chinese
U.S. Virgin Islanders
$41,461
MEDIAN FEMALE EARNINGS
97.5/ 100
METRIC RATING
109th/ 347
METRIC RANK
$36,424
MEDIAN FEMALE EARNINGS
0.1/ 100
METRIC RATING
278th/ 347
METRIC RANK
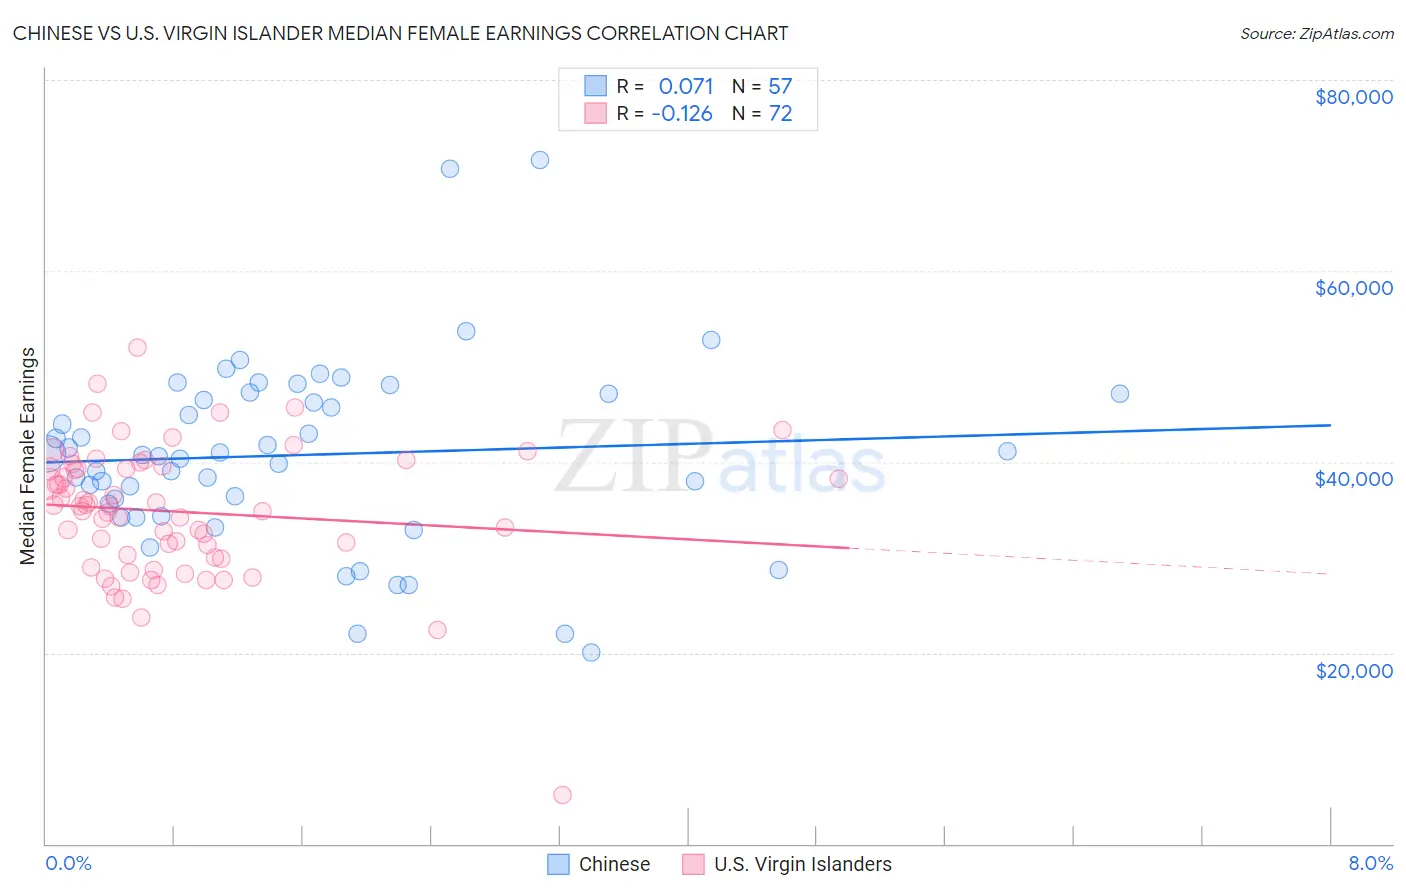
Chinese vs U.S. Virgin Islander Median Female Earnings Correlation Chart
The statistical analysis conducted on geographies consisting of 64,808,152 people shows a slight positive correlation between the proportion of Chinese and median female earnings in the United States with a correlation coefficient (R) of 0.071 and weighted average of $41,461. Similarly, the statistical analysis conducted on geographies consisting of 87,518,973 people shows a poor negative correlation between the proportion of U.S. Virgin Islanders and median female earnings in the United States with a correlation coefficient (R) of -0.126 and weighted average of $36,424, a difference of 13.8%.
Median Female Earnings Correlation Summary
| Measurement | Chinese | U.S. Virgin Islander |
| Minimum | $20,043 | $5,057 |
| Maximum | $71,591 | $51,985 |
| Range | $51,548 | $46,928 |
| Mean | $40,727 | $34,778 |
| Median | $40,673 | $35,393 |
| Interquartile 25% (IQ1) | $34,915 | $30,098 |
| Interquartile 75% (IQ3) | $47,174 | $39,427 |
| Interquartile Range (IQR) | $12,258 | $9,329 |
| Standard Deviation (Sample) | $9,803 | $6,997 |
| Standard Deviation (Population) | $9,716 | $6,948 |
Similar Demographics by Median Female Earnings
Demographics Similar to Chinese by Median Female Earnings
In terms of median female earnings, the demographic groups most similar to Chinese are Jordanian ($41,464, a difference of 0.010%), Palestinian ($41,484, a difference of 0.050%), Immigrants from Eritrea ($41,485, a difference of 0.060%), Italian ($41,505, a difference of 0.10%), and Immigrants from Zimbabwe ($41,527, a difference of 0.16%).
| Demographics | Rating | Rank | Median Female Earnings |
| Immigrants | Poland | 98.2 /100 | #102 | Exceptional $41,630 |
| Immigrants | Argentina | 97.9 /100 | #103 | Exceptional $41,554 |
| Immigrants | Zimbabwe | 97.8 /100 | #104 | Exceptional $41,527 |
| Italians | 97.7 /100 | #105 | Exceptional $41,505 |
| Immigrants | Eritrea | 97.6 /100 | #106 | Exceptional $41,485 |
| Palestinians | 97.6 /100 | #107 | Exceptional $41,484 |
| Jordanians | 97.5 /100 | #108 | Exceptional $41,464 |
| Chinese | 97.5 /100 | #109 | Exceptional $41,461 |
| Immigrants | Western Asia | 97.0 /100 | #110 | Exceptional $41,375 |
| Immigrants | Canada | 97.0 /100 | #111 | Exceptional $41,373 |
| Immigrants | North America | 96.7 /100 | #112 | Exceptional $41,319 |
| Macedonians | 96.4 /100 | #113 | Exceptional $41,286 |
| Immigrants | England | 96.4 /100 | #114 | Exceptional $41,277 |
| Koreans | 96.4 /100 | #115 | Exceptional $41,276 |
| Immigrants | Brazil | 96.4 /100 | #116 | Exceptional $41,273 |
Demographics Similar to U.S. Virgin Islanders by Median Female Earnings
In terms of median female earnings, the demographic groups most similar to U.S. Virgin Islanders are Immigrants from Caribbean ($36,414, a difference of 0.030%), Iroquois ($36,408, a difference of 0.050%), Spanish American ($36,391, a difference of 0.090%), Marshallese ($36,459, a difference of 0.10%), and Haitian ($36,374, a difference of 0.14%).
| Demographics | Rating | Rank | Median Female Earnings |
| Nicaraguans | 0.3 /100 | #271 | Tragic $36,904 |
| Immigrants | Dominican Republic | 0.3 /100 | #272 | Tragic $36,857 |
| Immigrants | Laos | 0.3 /100 | #273 | Tragic $36,841 |
| Immigrants | El Salvador | 0.2 /100 | #274 | Tragic $36,673 |
| Africans | 0.1 /100 | #275 | Tragic $36,530 |
| Central Americans | 0.1 /100 | #276 | Tragic $36,492 |
| Marshallese | 0.1 /100 | #277 | Tragic $36,459 |
| U.S. Virgin Islanders | 0.1 /100 | #278 | Tragic $36,424 |
| Immigrants | Caribbean | 0.1 /100 | #279 | Tragic $36,414 |
| Iroquois | 0.1 /100 | #280 | Tragic $36,408 |
| Spanish Americans | 0.1 /100 | #281 | Tragic $36,391 |
| Haitians | 0.1 /100 | #282 | Tragic $36,374 |
| Immigrants | Haiti | 0.1 /100 | #283 | Tragic $36,203 |
| Indonesians | 0.1 /100 | #284 | Tragic $36,140 |
| Paiute | 0.1 /100 | #285 | Tragic $36,056 |