Immigrants from the Azores vs Spanish Median Female Earnings
COMPARE
Immigrants from the Azores
Spanish
Median Female Earnings
Median Female Earnings Comparison
Immigrants from the Azores
Spanish
$38,573
MEDIAN FEMALE EARNINGS
8.8/ 100
METRIC RATING
221st/ 347
METRIC RANK
$38,098
MEDIAN FEMALE EARNINGS
3.5/ 100
METRIC RATING
241st/ 347
METRIC RANK
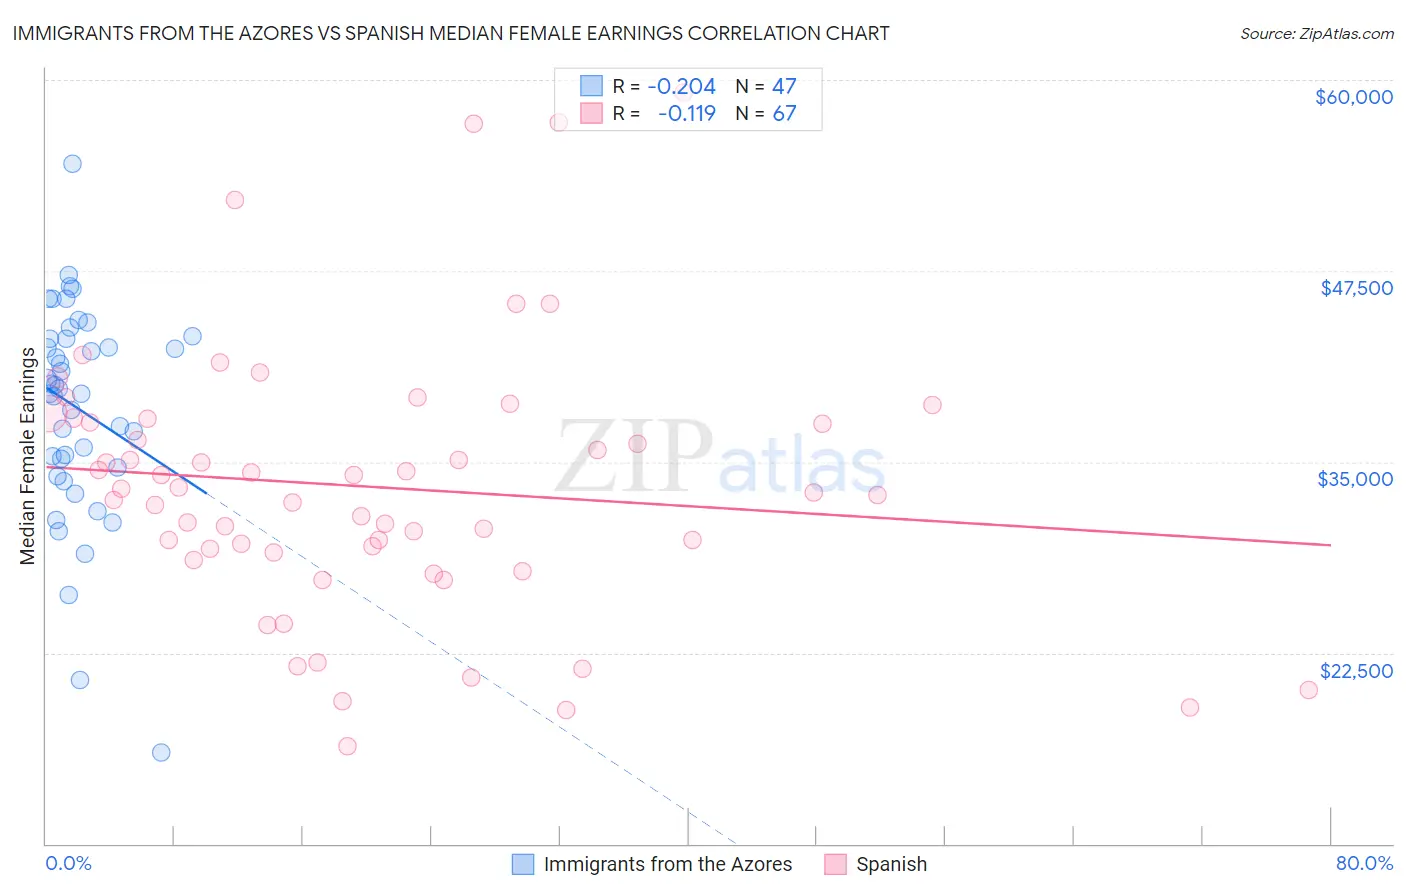
Immigrants from the Azores vs Spanish Median Female Earnings Correlation Chart
The statistical analysis conducted on geographies consisting of 46,252,710 people shows a weak negative correlation between the proportion of Immigrants from the Azores and median female earnings in the United States with a correlation coefficient (R) of -0.204 and weighted average of $38,573. Similarly, the statistical analysis conducted on geographies consisting of 421,897,645 people shows a poor negative correlation between the proportion of Spanish and median female earnings in the United States with a correlation coefficient (R) of -0.119 and weighted average of $38,098, a difference of 1.3%.
Median Female Earnings Correlation Summary
| Measurement | Immigrants from the Azores | Spanish |
| Minimum | $15,996 | $16,357 |
| Maximum | $54,521 | $59,157 |
| Range | $38,525 | $42,800 |
| Mean | $38,490 | $33,351 |
| Median | $39,828 | $33,021 |
| Interquartile 25% (IQ1) | $34,594 | $29,054 |
| Interquartile 75% (IQ3) | $43,084 | $37,790 |
| Interquartile Range (IQR) | $8,490 | $8,737 |
| Standard Deviation (Sample) | $7,045 | $8,760 |
| Standard Deviation (Population) | $6,970 | $8,694 |
Demographics Similar to Immigrants from the Azores and Spanish by Median Female Earnings
In terms of median female earnings, the demographic groups most similar to Immigrants from the Azores are Japanese ($38,528, a difference of 0.12%), Immigrants from Sudan ($38,511, a difference of 0.16%), Native Hawaiian ($38,461, a difference of 0.29%), French ($38,457, a difference of 0.30%), and French Canadian ($38,436, a difference of 0.36%). Similarly, the demographic groups most similar to Spanish are Finnish ($38,173, a difference of 0.20%), English ($38,196, a difference of 0.26%), Alaska Native ($38,202, a difference of 0.27%), Immigrants from Cabo Verde ($38,208, a difference of 0.29%), and Sudanese ($38,215, a difference of 0.31%).
| Demographics | Rating | Rank | Median Female Earnings |
| Immigrants | Azores | 8.8 /100 | #221 | Tragic $38,573 |
| Japanese | 8.1 /100 | #222 | Tragic $38,528 |
| Immigrants | Sudan | 7.8 /100 | #223 | Tragic $38,511 |
| Native Hawaiians | 7.1 /100 | #224 | Tragic $38,461 |
| French | 7.0 /100 | #225 | Tragic $38,457 |
| French Canadians | 6.8 /100 | #226 | Tragic $38,436 |
| Scottish | 6.3 /100 | #227 | Tragic $38,397 |
| Sub-Saharan Africans | 6.2 /100 | #228 | Tragic $38,391 |
| Belgians | 6.1 /100 | #229 | Tragic $38,382 |
| Basques | 5.7 /100 | #230 | Tragic $38,352 |
| Somalis | 5.5 /100 | #231 | Tragic $38,333 |
| Scandinavians | 5.2 /100 | #232 | Tragic $38,306 |
| Tongans | 5.1 /100 | #233 | Tragic $38,288 |
| Celtics | 5.0 /100 | #234 | Tragic $38,283 |
| Sudanese | 4.4 /100 | #235 | Tragic $38,215 |
| Liberians | 4.4 /100 | #236 | Tragic $38,215 |
| Immigrants | Cabo Verde | 4.3 /100 | #237 | Tragic $38,208 |
| Alaska Natives | 4.3 /100 | #238 | Tragic $38,202 |
| English | 4.2 /100 | #239 | Tragic $38,196 |
| Finns | 4.0 /100 | #240 | Tragic $38,173 |
| Spanish | 3.5 /100 | #241 | Tragic $38,098 |