Ghanaian vs Spanish Median Female Earnings
COMPARE
Ghanaian
Spanish
Median Female Earnings
Median Female Earnings Comparison
Ghanaians
Spanish
$40,429
MEDIAN FEMALE EARNINGS
82.1/ 100
METRIC RATING
146th/ 347
METRIC RANK
$38,098
MEDIAN FEMALE EARNINGS
3.5/ 100
METRIC RATING
241st/ 347
METRIC RANK
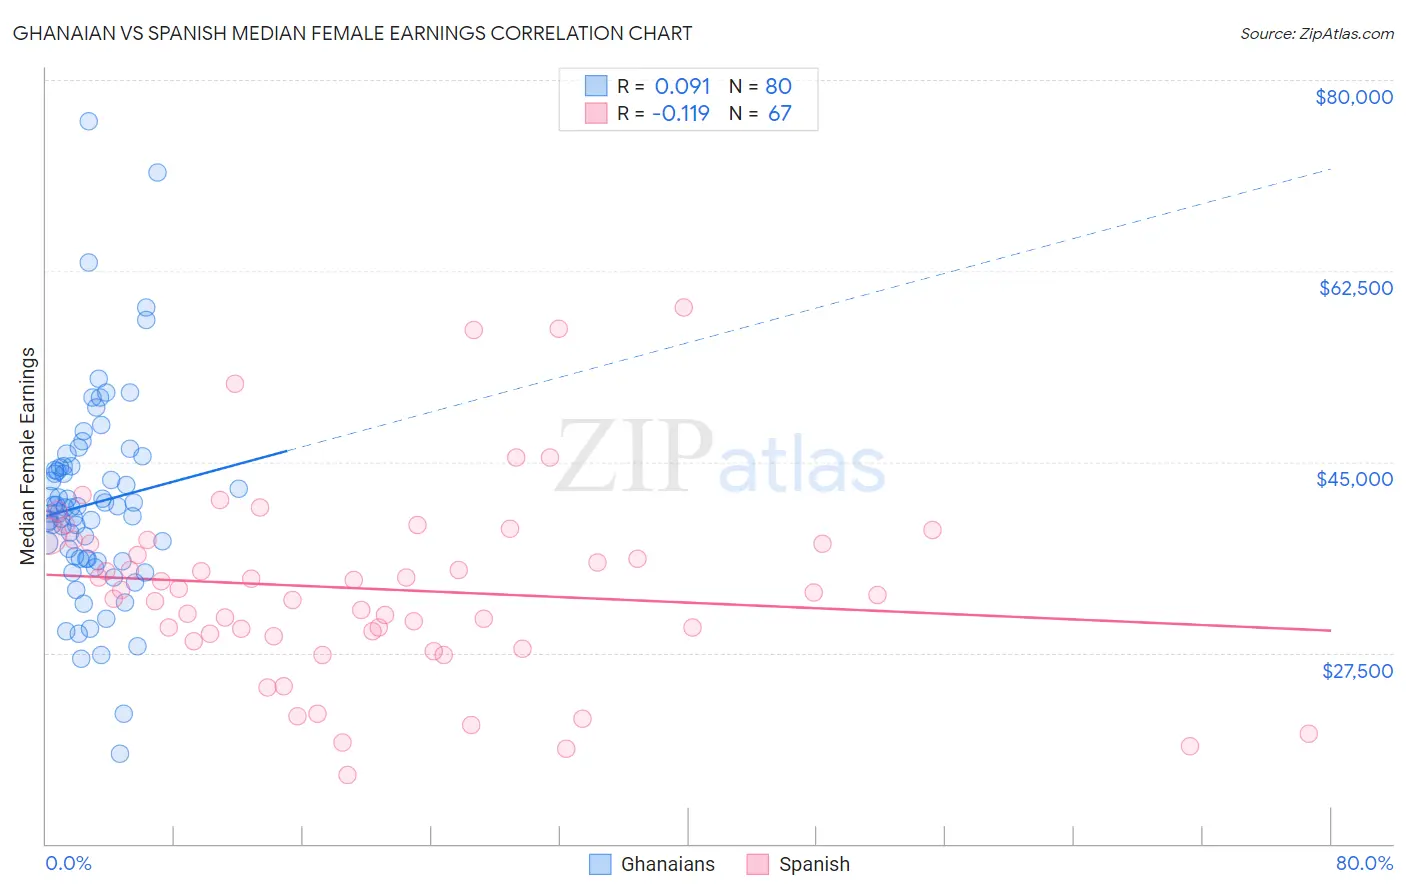
Ghanaian vs Spanish Median Female Earnings Correlation Chart
The statistical analysis conducted on geographies consisting of 190,707,731 people shows a slight positive correlation between the proportion of Ghanaians and median female earnings in the United States with a correlation coefficient (R) of 0.091 and weighted average of $40,429. Similarly, the statistical analysis conducted on geographies consisting of 421,897,645 people shows a poor negative correlation between the proportion of Spanish and median female earnings in the United States with a correlation coefficient (R) of -0.119 and weighted average of $38,098, a difference of 6.1%.
Median Female Earnings Correlation Summary
| Measurement | Ghanaian | Spanish |
| Minimum | $18,266 | $16,357 |
| Maximum | $76,246 | $59,157 |
| Range | $57,980 | $42,800 |
| Mean | $41,171 | $33,351 |
| Median | $40,828 | $33,021 |
| Interquartile 25% (IQ1) | $36,123 | $29,054 |
| Interquartile 75% (IQ3) | $44,535 | $37,790 |
| Interquartile Range (IQR) | $8,413 | $8,737 |
| Standard Deviation (Sample) | $9,292 | $8,760 |
| Standard Deviation (Population) | $9,234 | $8,694 |
Similar Demographics by Median Female Earnings
Demographics Similar to Ghanaians by Median Female Earnings
In terms of median female earnings, the demographic groups most similar to Ghanaians are Brazilian ($40,483, a difference of 0.13%), Vietnamese ($40,377, a difference of 0.13%), Northern European ($40,491, a difference of 0.15%), Immigrants from North Macedonia ($40,488, a difference of 0.15%), and Polish ($40,371, a difference of 0.15%).
| Demographics | Rating | Rank | Median Female Earnings |
| Immigrants | South Eastern Asia | 85.7 /100 | #139 | Excellent $40,558 |
| Serbians | 85.2 /100 | #140 | Excellent $40,539 |
| Immigrants | Syria | 84.1 /100 | #141 | Excellent $40,499 |
| Sri Lankans | 84.0 /100 | #142 | Excellent $40,496 |
| Northern Europeans | 83.9 /100 | #143 | Excellent $40,491 |
| Immigrants | North Macedonia | 83.8 /100 | #144 | Excellent $40,488 |
| Brazilians | 83.6 /100 | #145 | Excellent $40,483 |
| Ghanaians | 82.1 /100 | #146 | Excellent $40,429 |
| Vietnamese | 80.4 /100 | #147 | Excellent $40,377 |
| Poles | 80.2 /100 | #148 | Excellent $40,371 |
| Immigrants | Cameroon | 79.7 /100 | #149 | Good $40,354 |
| Immigrants | Chile | 79.6 /100 | #150 | Good $40,353 |
| Immigrants | Armenia | 79.2 /100 | #151 | Good $40,340 |
| West Indians | 78.4 /100 | #152 | Good $40,317 |
| British West Indians | 77.7 /100 | #153 | Good $40,299 |
Demographics Similar to Spanish by Median Female Earnings
In terms of median female earnings, the demographic groups most similar to Spanish are Immigrants from Burma/Myanmar ($38,028, a difference of 0.18%), Finnish ($38,173, a difference of 0.20%), English ($38,196, a difference of 0.26%), Alaska Native ($38,202, a difference of 0.27%), and Immigrants from Cabo Verde ($38,208, a difference of 0.29%).
| Demographics | Rating | Rank | Median Female Earnings |
| Celtics | 5.0 /100 | #234 | Tragic $38,283 |
| Sudanese | 4.4 /100 | #235 | Tragic $38,215 |
| Liberians | 4.4 /100 | #236 | Tragic $38,215 |
| Immigrants | Cabo Verde | 4.3 /100 | #237 | Tragic $38,208 |
| Alaska Natives | 4.3 /100 | #238 | Tragic $38,202 |
| English | 4.2 /100 | #239 | Tragic $38,196 |
| Finns | 4.0 /100 | #240 | Tragic $38,173 |
| Spanish | 3.5 /100 | #241 | Tragic $38,098 |
| Immigrants | Burma/Myanmar | 3.0 /100 | #242 | Tragic $38,028 |
| Germans | 2.8 /100 | #243 | Tragic $37,986 |
| Immigrants | Liberia | 2.7 /100 | #244 | Tragic $37,970 |
| Immigrants | Middle Africa | 2.7 /100 | #245 | Tragic $37,965 |
| Delaware | 2.6 /100 | #246 | Tragic $37,964 |
| Immigrants | Somalia | 2.4 /100 | #247 | Tragic $37,914 |
| Alaskan Athabascans | 2.3 /100 | #248 | Tragic $37,905 |